Working with the different databases
Working with one of the databases listed in the Tree Area involves several, frequently all four areas of your screen. In this chapter, we will briefly demonstrate how to operate the individual databases.
Biomodels
Biomodels is a source of mathematical models suitable for simulating biological processes. They have been compiled by the BioModels.Net project (http://www.biomodels.net/). These models are stored in the geneXplain platform as database Biomodels, subdirectory Diagrams, along with their graphical representations, parameters, simulation default values, etc. The present version is release 25, comprising 426 curated and 522 non-curated diagrams
You can access the Biomodels contents by browsing or searching. When you browse the list of models in the Tree Area (Databases > Biomodels > Diagrams), please note that only 50 of either 421 curated or 433 non-curated diagrams are displayed at once. Selecting one of the models is by double-clicking on the respective name.
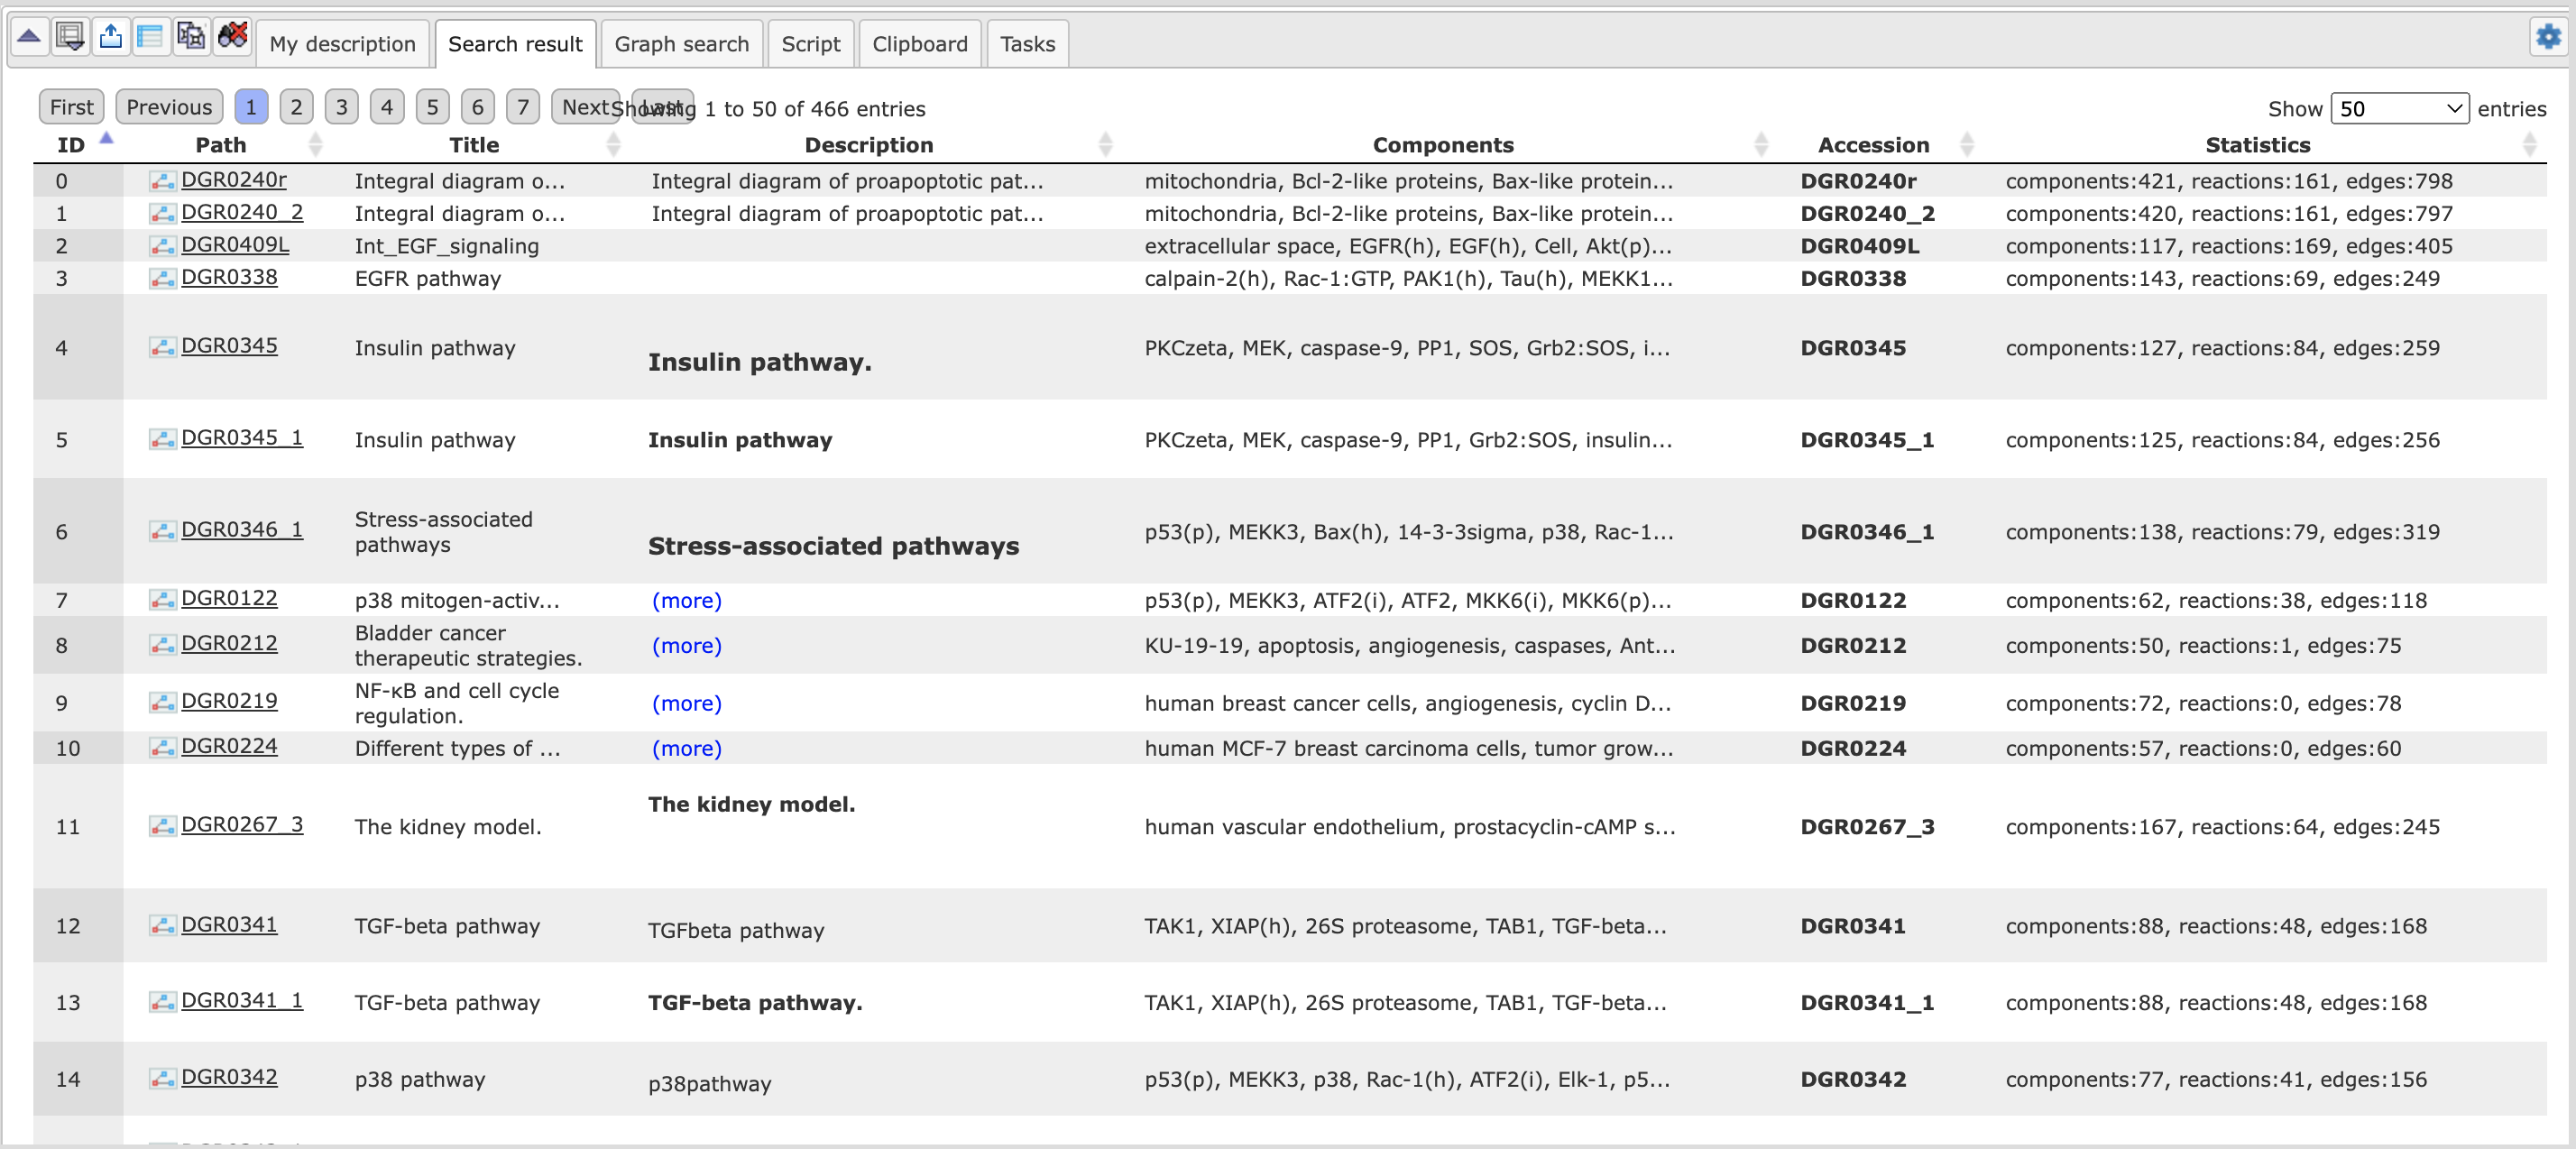
Searching for a model starts from the Search tab in the Info Box. You may enter,
for instance, glycolysis and start the search with the button  You will get back 75 entries, the contents displayed under the tab Search
result in the Operations Field, the information given being essentially
self-explaining: A short description of the model including references is given.
You may open any model by a click on the corresponding Accession number in the
last column.
You will get back 75 entries, the contents displayed under the tab Search
result in the Operations Field, the information given being essentially
self-explaining: A short description of the model including references is given.
You may open any model by a click on the corresponding Accession number in the
last column.
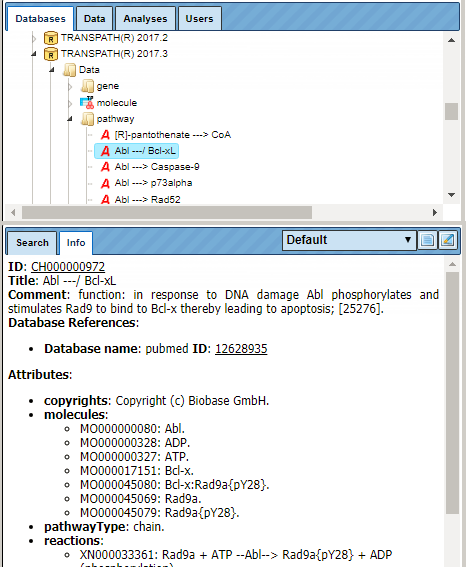
Having opened one of the diagrams by either method, the network schema will appear in the Work Space as well as in the Operations Field, tab Overview. The tab Layout provides a number of options for changing the layout style of the diagram (see description of the method Diagram layouts); none of these options will change the diagram contents. Clicking on an individual node will show information about this component and its role in this model within the Info Box (tab Info).
Many Biomodels have been optimized for dynamic simulation. Open, for instance, the subdirectory Diagrams and double-click Goldbeter1991_MinMitOscil_ExplInact. The diagram will open in the Work Space, the tab Info in the Info Box will show some details about the model, database links for the individual components. In the Operations Field, under the tab “My description”, a detailed description of the model is given; it shows the original reference, its abstract and the PubMed link. Further information about how the model was constructed is added.
Under the tabs Simulation, you will find the default settings for the simulation, which can be changed before launching the simulation by start button. The simulation results will be graphically displayed in a new window, which can be saved as image using the Export button in the Control Panel . For this, a number of formats are available.
Biopath
Biopath is a collection of molecular pathways, manually annotated from original scientific publications and comprising biological models and diagrams. A more detailed description can be found in the Info Box, tab Info, after clicking on the term Biopath in the Tree Area, Databases.
User accessible entities are stored in the subdirectory Diagrams (presently 571).
This way, you may browse the database contents, receiving information about the
individual entities in the Info Box, after a single click with the left mouse
button on the corresponding entity. The Diagrams can be opened by double-clicking
with the left mouse button, or by opening a context menu with the right mouse
button and selecting “Open diagram”. These diagrams contain their components
listed underneath as nodes ( ) and edges
(
) and edges
( ), for which additional information can be retrieved in the same way as for the
whole diagram. Many of them may be assigned to a hierarchy of compartments.
), for which additional information can be retrieved in the same way as for the
whole diagram. Many of them may be assigned to a hierarchy of compartments.
If you select the Biopath database for a search, you may enter a gene name into the field of the Search tab in the Info Box (try, for instance, AKT1). In the Operations Field, under the tab Search result, you will find the following hit:
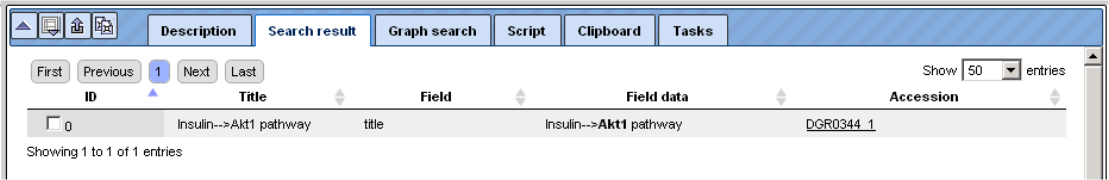
It shows the molecule encoded by the gene AKT1 being involved in the insulin pathway. The hyperlinked Accession number here opens a pathway diagram from the Biopath database, which includes insulin and AKT1 as well as the path between them. The pathway is shown in full in the Work Space; an overview is depicted under the “Overview” tab of the Operations Field:
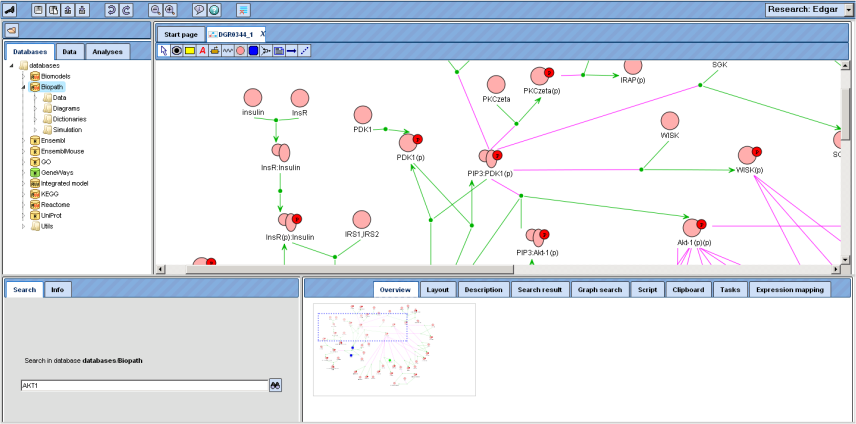
The part of the diagram that is displayed in the Work Space is framed by the dotted blue line in the Overview, which can be shifted with the mouse, the Work Space adapting accordingly. You may also shift your mouse pointer over the Work Space: It turns into a hand, indicating that you can now shift the diagram section in the display by pressing the left mouse button and moving the mouse accordingly. The dotted blue rectangle in the “Overview” tab of the Operations Field will move accordingly.
Information about an individual node can be obtained in the Info Box after double-click on the corresponding symbol in the Work Space.
In the diagram, green arrows represent conversions, magenta edges catalytic effects. To facilitate overview in complex diagrams, individual edges are highlighted in light blue on mouse-over.
Ensembl
The Ensembl database provides annotation of genes from the Ensembl genome databases (http://www.ensembl.org/index.html). Presently, there are human, mouse and rat Ensembl data included in the geneXplain platform, separately listed on the Databases tab. The following versions are provided:
Human:
Genome build hg38, version 91.38
Genome build hg38, version 84.38
Genome build hg19, version 72.37
Genome build hg19, version 65.37
Genome build hg18, version 61.37f
Mouse:
Genome build mm10, version 91.38
Genome build mm10, version 84.38
Genome build mm10, version 72.38
Genome build mm10, version 84.38
Genome build mm9, version 65.37
Rat:
Genome build rn5, version 71.5
Genome build rn4, version 65.34
Genome build rn6, version 84.6
Genome build rn6, version 91.6
In the subdirectories “Sequences/Chromosomes …” the individual chromosomes of the corresponding genome are stored. A double-click on an individual chromosome symbol opens the corresponding object with its annotation in the genome browser of the geneXplain platform. Here, you can move the mouse pointer along the sequence to select a certain position. With the Zoom-in, Zoom-out button, you can go up to a level where you have the whole chromosome displayed or down to a level where you see the individual nucleotides. The view can be adjusted accordingly with the control panel buttons, mouse over message describes the functionality of the buttons in detail. The mode can be selected from detailed, default, and overview.
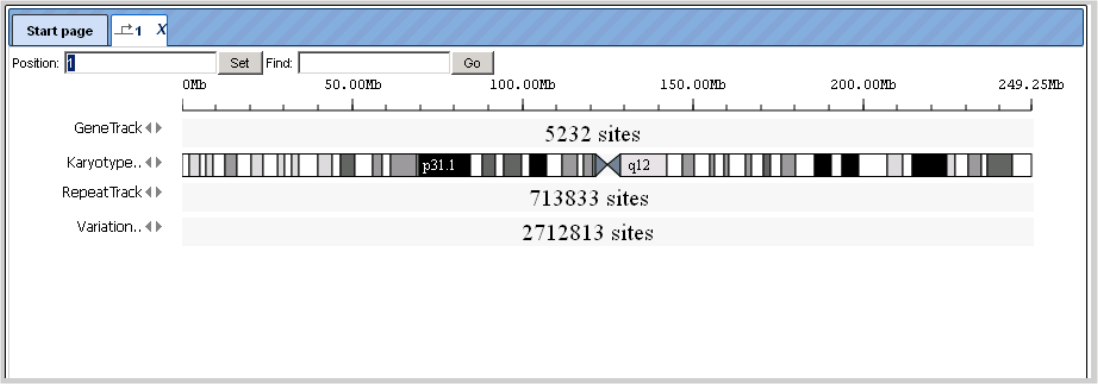
At an intermediate resolution of, e.g., human chromosome 1, you see individual genes highlighted in the Work Space:
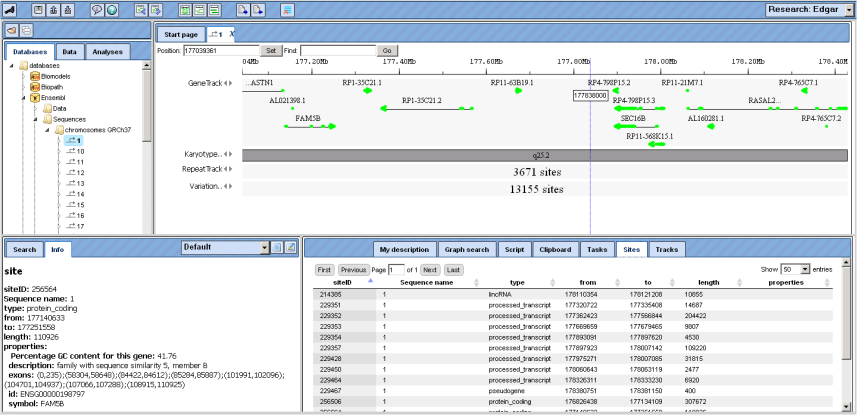
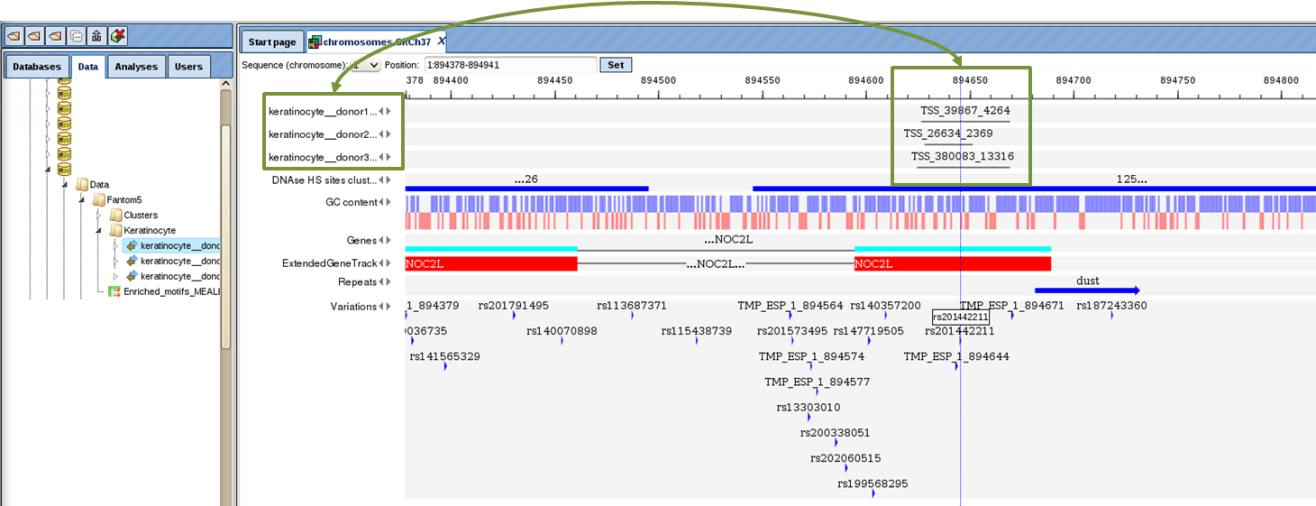
The alignment of genes and other genomic data against a reference genome can be viewed as data tracks in genome browser. The GeneTrack shows the localization of primary transcripts including intron/exon structure and direction of transcription. Scrolling backwards and forward through the genome can be done using the arrowheads next to the track name, or with the buttons “Page backward” and “Page forward” , respectively.
Information about individual genes is displayed in the Info Box after clicking on the respective gene symbol in the Work Space; on the Sites tab of the Operations Field, a detailed list of all functional sites
The KaryotypeTrack shows on which arm and in which karyotypic band(s) of the chromosome the present view is located.
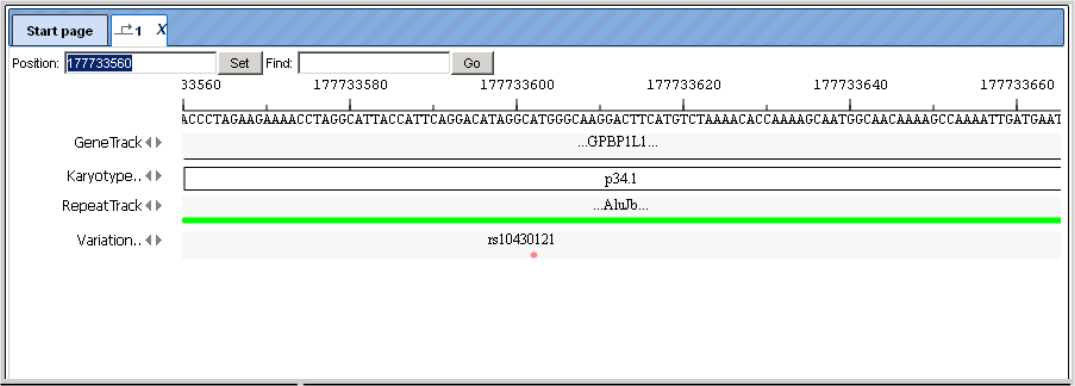
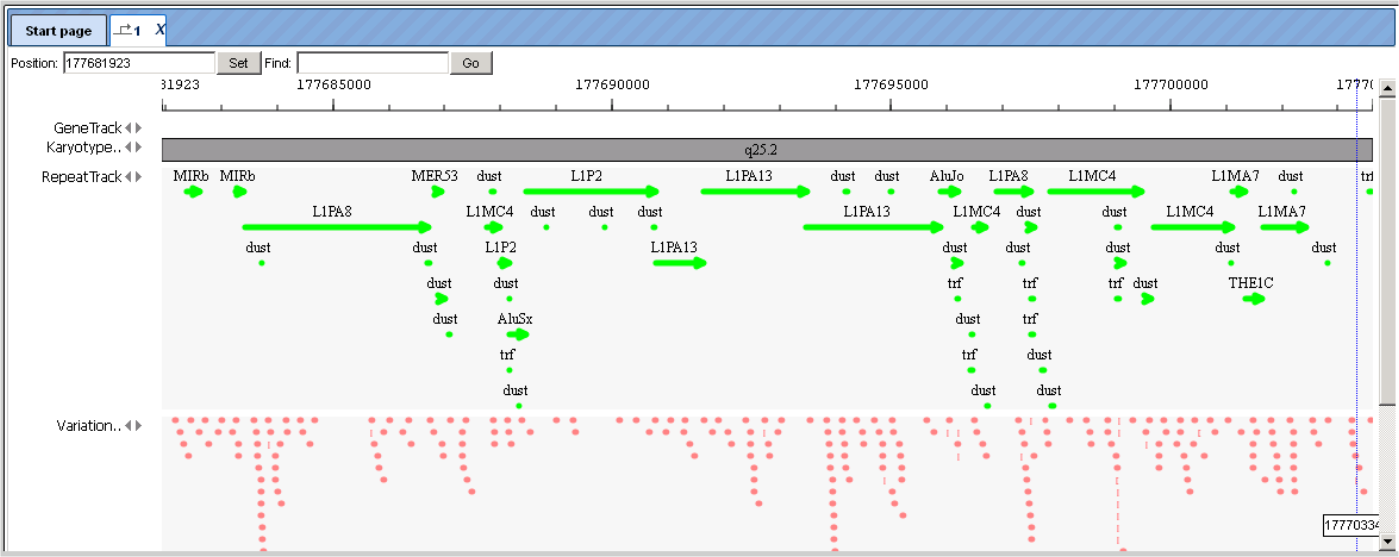
RepeatTrack and VariationTrack comprise large numbers of sites scattered all over the chromosome. In a resolution like the one given above, only summarizing figures can be given. When zooming in, at a certain level of resolution, localization of individual repeats and their names will appear, and similarly sequence variations will show up in the Work Space, and they are listed in the Operations Field, under the Sites tab. Note that information about individual sites can be invoked in the Info Box only after a resolution has been adjusted that allows the display of their names in the Work Space, since the names are the clickable items.
The color scheme for the display in the Work Space can be changed in the Operations Field; here, on the Tracks tab, you can adjust the settings of the genome browser:
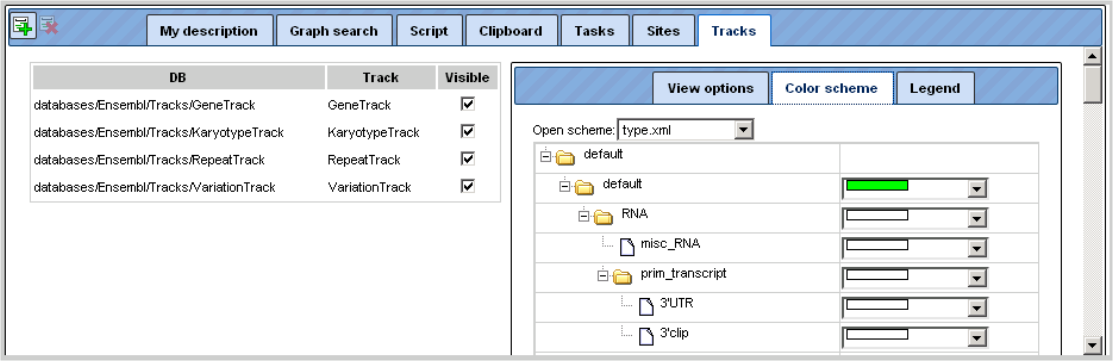
Individual tracks can be removed from the display in the Work Space (e.g. by
de-selecting them on this tab). The same way, they can be brought back. Another
possibility is to open the subdirectory Tracks in the Tree Area, where all
available tracks are listed with the symbol 
Just drag-and-drop the track of interest to the Work Space will render the corresponding data amenable to the browser.
The Ensembl database sections are searchable in the same way as described
before: Just click on the name of the respective database in the Tree Area, so
that it receives a light-blue background and its path appears on the Search tab
of the Info Box. Enter your search term, launch the search by pressing and find your Search results on the respective tab on the Operations Field. Among the multiple hits, the one with the perfect match will be highlighted in
bold.
Gene Ontology (GO)
Contents from Gene Ontology are imported into the geneXplain platform and are
updated regularly. The present version is 06.2015.
GO is searchable in the same way as described before: Just click on the name GO
in the Tree Area, so that it receives a light-blue background and its path
appears on the Search tab of the Info Box. Enter your search term, launch the
search by pressing , and find your Search results on the respective tab on the Operations Field. When clicking on linked descriptions, additional information will appear in the Info Box, Info tab.
GeneWays
GeneWays is a database about genes and their functional interactions. The underlying data (version 7.0) have been retrieved from the original scientific literature by a sophisticated text mining system applied to more than 360,000 full text papers and of more than eight million publication abstracts [Iossifov I., Rodriguez-Esteban R., Mayzus I., Millen K.J., and Rzhetsky A. Looking at cerebellar malformations through text-mined interactomes of mice and humans. PLoS Comput Biol. 2009, 5:e1000559. PubMed PMID: 19893633].
The directory GeneWays/Data has two subdirectories: Genes and Reactions. When you click on any gene entry, information about the gene will be retrieved from the Entrez database. When you click on any reaction entry, you will find reaction title, links to Entrez for both incoming and outgoing molecules and the link to the PubMed entries of the corresponding publication in the Info Box.
A single click on the term GeneWays in the Tree Area / Databases suffices to
indicate this data source in the Info Box, tab Search. You can insert your
search term (e.g., a gene symbol) into the field underneath. Clicking on the
icon launches the search. The search routine scans for exact matches, but use of
wildcards is possible. Thus, searching for elk* returns results for elk1, elk2p1, elk3, and elk4.
The results will be shown in the Operations Field, under the tab Search result. For instance, when searching in GeneWays for JAG1, the following result table will be displayed:
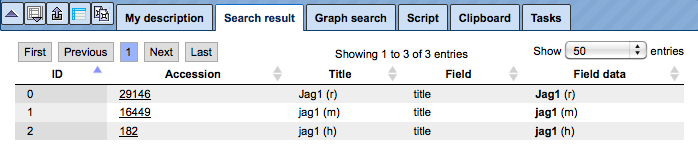
The search term is highlighted in bold.
You may recognize that the numbers in the last column (Accession) are hyperlinked. When you click on them, information about the gene will be retrieved from the Entrez database at NCBI, displayed in a new window or tab, depending on your browser settings. Rows referring to reactions show a different type of accession number, they are linked to a PubMed entry of the corresponding publication.
Reactome
Reactome is a database that provides information on biological objects such as proteins, protein complexes, reactions etc. It is an open-source, open access, manually curated and peer-reviewed pathway database. Pathway annotations are authored by expert biologists in collaboration with the Reactome editorial staff, and cross-referenced to many bioinformatics databases. The contents of Reactome are copyright © 2003-2010 Cold Spring Harbor Laboratory (CSHL), Ontario Institute for Cancer Research (OICR) and the European Bioinformatics Institute (EBI).
So far 7583 diagrams have been imported from version 63 of this database into the geneXplain platform. They can be used as graphical and editable schemata. In the Tree Area, all components are listed in each diagram subdirectory.
TRANSPATH®
TRANSPATH® is BIOBASE’s database about signal transduction and metabolic pathways in human and the most important model organisms, mouse and rat. Its particular structure, which models signaling components and reactions in multiple hierarchical ways, makes TRANSPATH® a unique resource for both encyclopedic and modeling purposes.
Under the geneXplain platform, the TRANSPATH directory contains the following folders:
Data
Diagrams
Dictionaries
Layouts
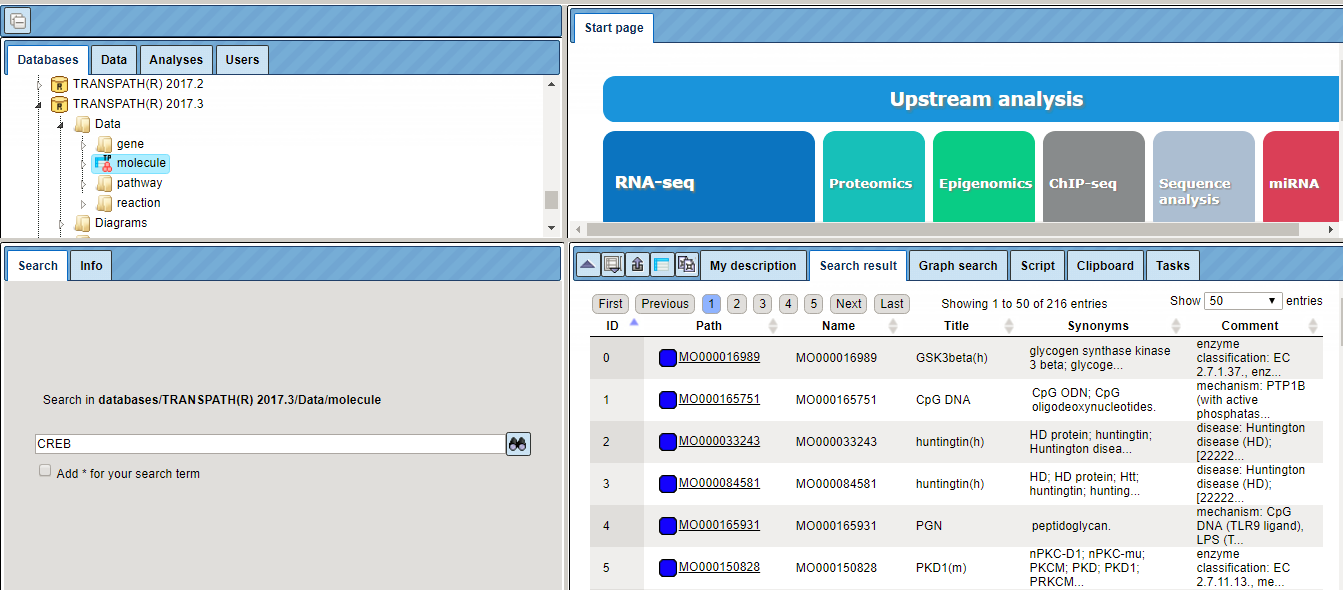
Under “Data”, browsable lists of objects, like genes and molecules, and of processes, like reactions and pathways, are stored. As usual, detailed database contents are displayed in the Info Box upon selecting individual entities from the lists by mouse click.
As for other databases, the Search tab in the Info Box provides an easy search function to retrieve individual entities from the resource. The search results are displayed in the Operations Field, amenable to further activities.
GTRD
GTRD (Gene Transcription Regulation Database) is a database of weight matrices to recognize transcription factor binding sites. The GTRD library of weight matrices consists of new matrices derived from ChIP-seq data by applying our multiple alignment method IPSmatrix. The IPSmatrix represents a modification of the previously published alignment method [Ananko E.A. et al. Recognition of interferon-inducible sites, promoters, and enhancers. BMC Bioinformatics 2007, 8:56. PMID: 17309789]. Each individual matrix is derived from an analysis of the corresponding set of TF-binding regions obtained from a set of raw ChIP-seq data. It is assumed that:
some TF-binding regions do not contain TF-binding sites; strand orientation and exact location of TF-binding sites in TF-binding regions are unknown.
The IPSmatrix relies on the Gibbs sampling principle and our conception of the Individual Probability Score (IPS) where IPS represents the extension of the common matrix score. In addition to the cores of TF-binding sites, the IPSs take advantage of nucleotide contents of both flanks of site cores.
When several ChIP-seq datasets are available for a single TF, several matrices were calculated from which the optimal matrix was selected by comparing the corresponding Receiver Operator Characteristic (ROC) curves.
In the GTRD directory of the geneXplain platform, the folder “matrices” provides the list of matrices generated in the way described. You may also wish to include at this point a matrix collection provided by the UniProbe database.
Under “profiles”, the matrices are stored along with thresholds that are to be applied when using the matrices for TFBS recognition. All these “profiles” are grouped according to three different thresholds (strong, moderate and weak).
The directory “tracks” provides ChIP-seq (or ChIP-chip) data, e.g. from GEO (Gene Expression Omnibus database at NCBI) in a format that renders them suitable for visualization in the Genome Browser.
Under “views”, available matrices (PWMs), underlying ChIP-seq experiments or the TFs themselves can be browsed. They are arranged according to the most recent classification of human TFs (http://www.edgar-wingender.de/huTF_classification.html) and extended to mouse and rat homologs.
In cases where several ChIP-seq experiments are available to deduce matrices, all respective logo plots are given when navigating down to the level of individual TFs.
TRANSFAC®
TRANSFAC® is the most comprehensive database on eukaryotic transcription factors (TFs), their genomic DNA-binding sites and DNA-binding profiles. It is a commercial database, maintained and distributed by BIOBASE GmbH as well as, in most countries, also offered for licensing by geneXplain. A valid license is thus required to access the contents of this database.
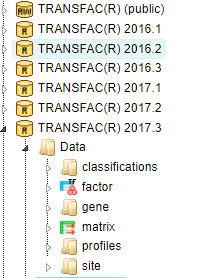
In the TRANSFAC folder labeled according to the respective release, there is the data subdirectory with the areas “classifications”, “factor”, “gene”, “matrix”, “profiles” and “site”:
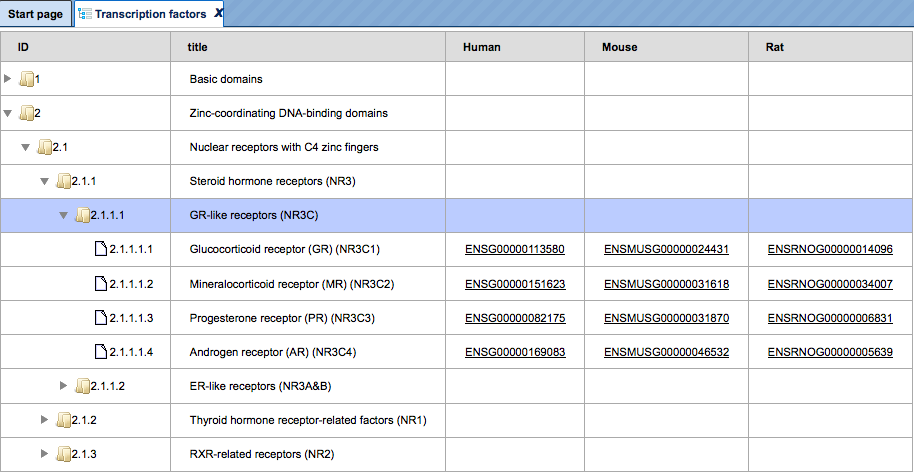
Under “classifications”, the class definitions of DNA-binding domains of eukaryotic TFs are listed with their accession numbers (such as C0001 for “zinc finger”). Clicking on any item invokes further information in the Info Box. The same holds for taxa (of biological species), and for the TF classification as it was basically established in 1999.
By clicking on the folder “factor”, you can browse all TF accession numbers, with detailed information about any selected TF appearing in the Info Box. The same applies to the folder “matrix”, which lists all PWMs available in the actual database release, and the Info Box displaying the matrix and the corresponding logo plot.
Under “profiles”, matrix collections are given for TFs that are known to play a role in a certain biological context, as defined by the profile name.
The TRANSFAC folder “Dictionaries” contains mostly files with links to other databases for internal use of the program.
Fantom5 cell-type and tissue-specific transcription start sites
The Fantom5 databases (Fantom5-Cell and Fantom5-Tissue) provide cell- and tissue-type specific transcription start site (TSS) annotations derived from CAGE measurements of the functional annotation of the mammalian genome 5 (FANTOM5) project (FANTOM Consortium, Nature 507:462-470, 2014). The databases cover 171 cell types and 121 tissue types (plus one type of default TSSs from Ensembl), respectively.
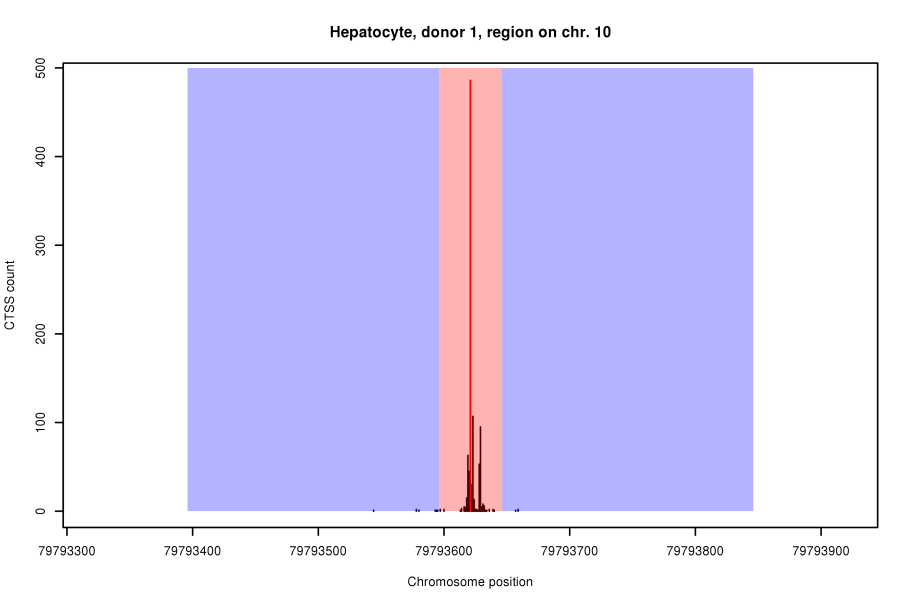
TSSs were inferred by a two-step process. The data for inference were the number of Cage TSSs (CTSSs) that had been mapped experimentally to genomic locations. First, a set of CTSS clusters was obtained by a sliding-window method similar to the one described by Strbenac et al. (BMC Genomics 5:S9, 2013). As illustrated in the figure below, this method used estimates of the rate of CTSS “hits” per nucleotide to calculate a statistical significance for the putative TSS (red line) on the basis of the Poisson distribution. For this, local background CTSS rates were calculated from flanking regions (blue areas) of a putative TSS (red line), excluding its direct vicinity (red area).
In the second step, we further refined the initial CTSS clusters using a Hidden Markov Model (HMM). The HMM modelled CTSS hits in TSS regions as well as in the genomic background by negative binomial distributions whose parameters, as well as their transitions, were estimated from the first set of CTSS clusters.
The HMM-based CTSS clusters from corresponding cell or tissue samples (the Fantom5 project collected tissue or cell samples from several donors) were eventually grouped into sets of overlapping clusters and annotated with high CTSS mark as consensus TSS.
The derived databases are now available in the geneXplain platform denoted as Fantom5-Cell and Fantom5-Tissue. Condition-specific TSSs can be extracted for gene sets using the tool named “Create tissue-specific promoter track”.
Other data sets
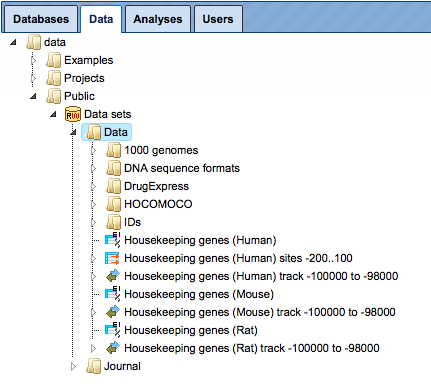
In addition to databases, there are several datasets available within the platform that might be interesting to make use of in particular analyses. The datasets are available under the tab Data in the folder Public, within the project Data sets.
DrugExpress – genome-wide transcriptional signatures of drug response
The folder DrugExpress contains sets of genes that significantly change their expression in response to treatment by different drugs. It originates from the Connectivity Map (also known as cmap) project developed at the Broad Institute, USA, http://www.broadinstitute.org/cmap/.
In this collection, we identified 321 compounds that could be mapped to Drugbank (http://www.drugbank.ca/), and also have known target genes in Drugbank. The following steps were performed:
Data normalization with affy package in R with parameters: method=”quantiles”, bgcorrect.method=”rma”, pmcorrect.method=”pmonly”, summary.method=”liwong”.
Gene IDs were converted into Ensembl IDs using Convert table analysis.
Up- and down-regulated genes were identified applying the following criteria: (LogFoldChange >= 0.7) and (p_value <= 0.05) for up-regulated genes, and (LogFoldChange <= -0.7) and (p_value <= 0.05) for down-regulated genes. LogFoldChange is a logarithm of fold change with base 2 of gene expression in treated versus untreated cells.
The DrugExpress folder contains 321 gene tables for up-regulated and 321 gene tables for down-regulated genes for each chemical compound or drug, altogether 642 gene tables. The names of the files correspond to the names of the chemical compounds. Along with the individual files, there are 17 subfolders, in which the files are grouped according to the classification of the respective drugs (for example, “adrenergic antagonist”).
Search with DrugExpress Database
To search within the DrugExpress database you have to switch from Default mode to DrugExpress, mode using the drop-down menu at the top right corner (see picture below). The input mask of the search page appears automatically in the main Workspace.
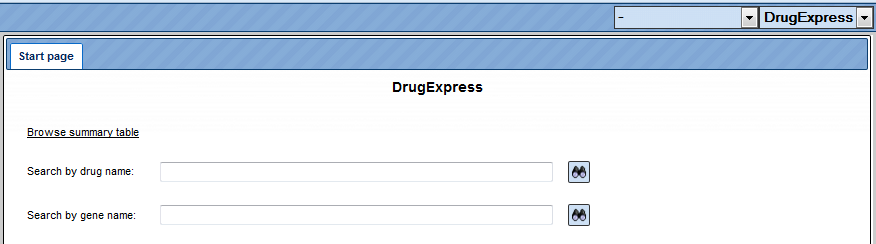
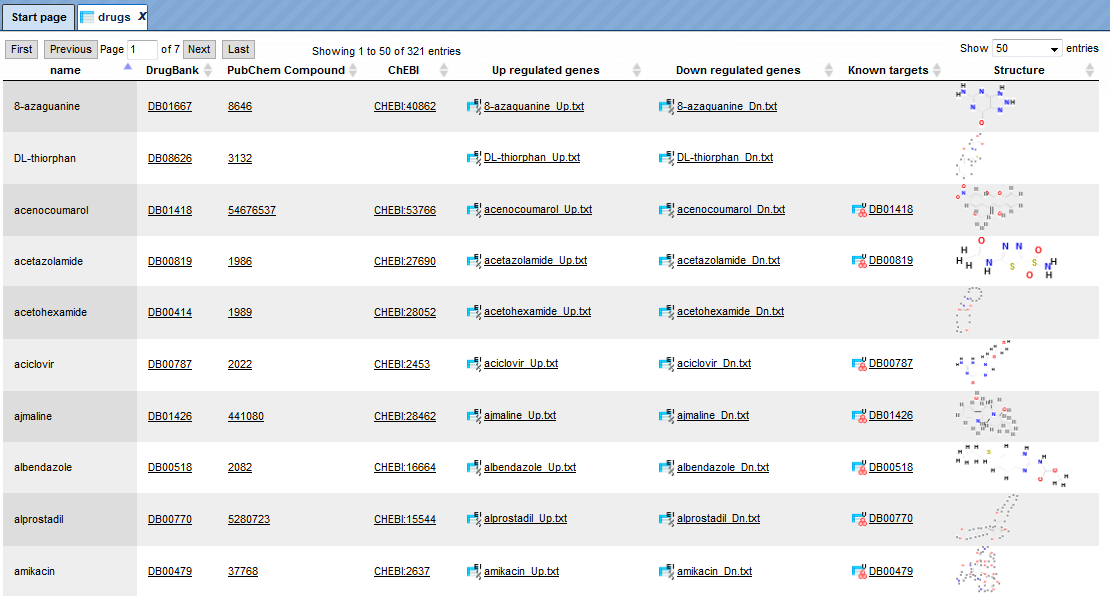
Browsing the summary drug table can be done by clicking the link “Browse summary table”. The table with 321 entries, corresponding to the represented drugs, will be automatically opened as shown below. The columns of the table are sorted alphabetically. The links to the following external databases are provided:
Drug Bank (http://www.drugbank.ca/drugs),
PubChem Compound (https://www.ncbi.nlm.nih.gov/pccompound),
ChEBI (http://www.ebi.ac.uk/chebi/init.do).
The next columns provide links to the gene lists of all up- and down-regulated genes in response to drug treatment. The Known targets for every drug is shown in the next column. A Structure of the drug is visible in the last column of the table.
Let’s close the summary table to return to the search form of the DrugExpress
database. To search by the drug name, you can type in your search term and press 
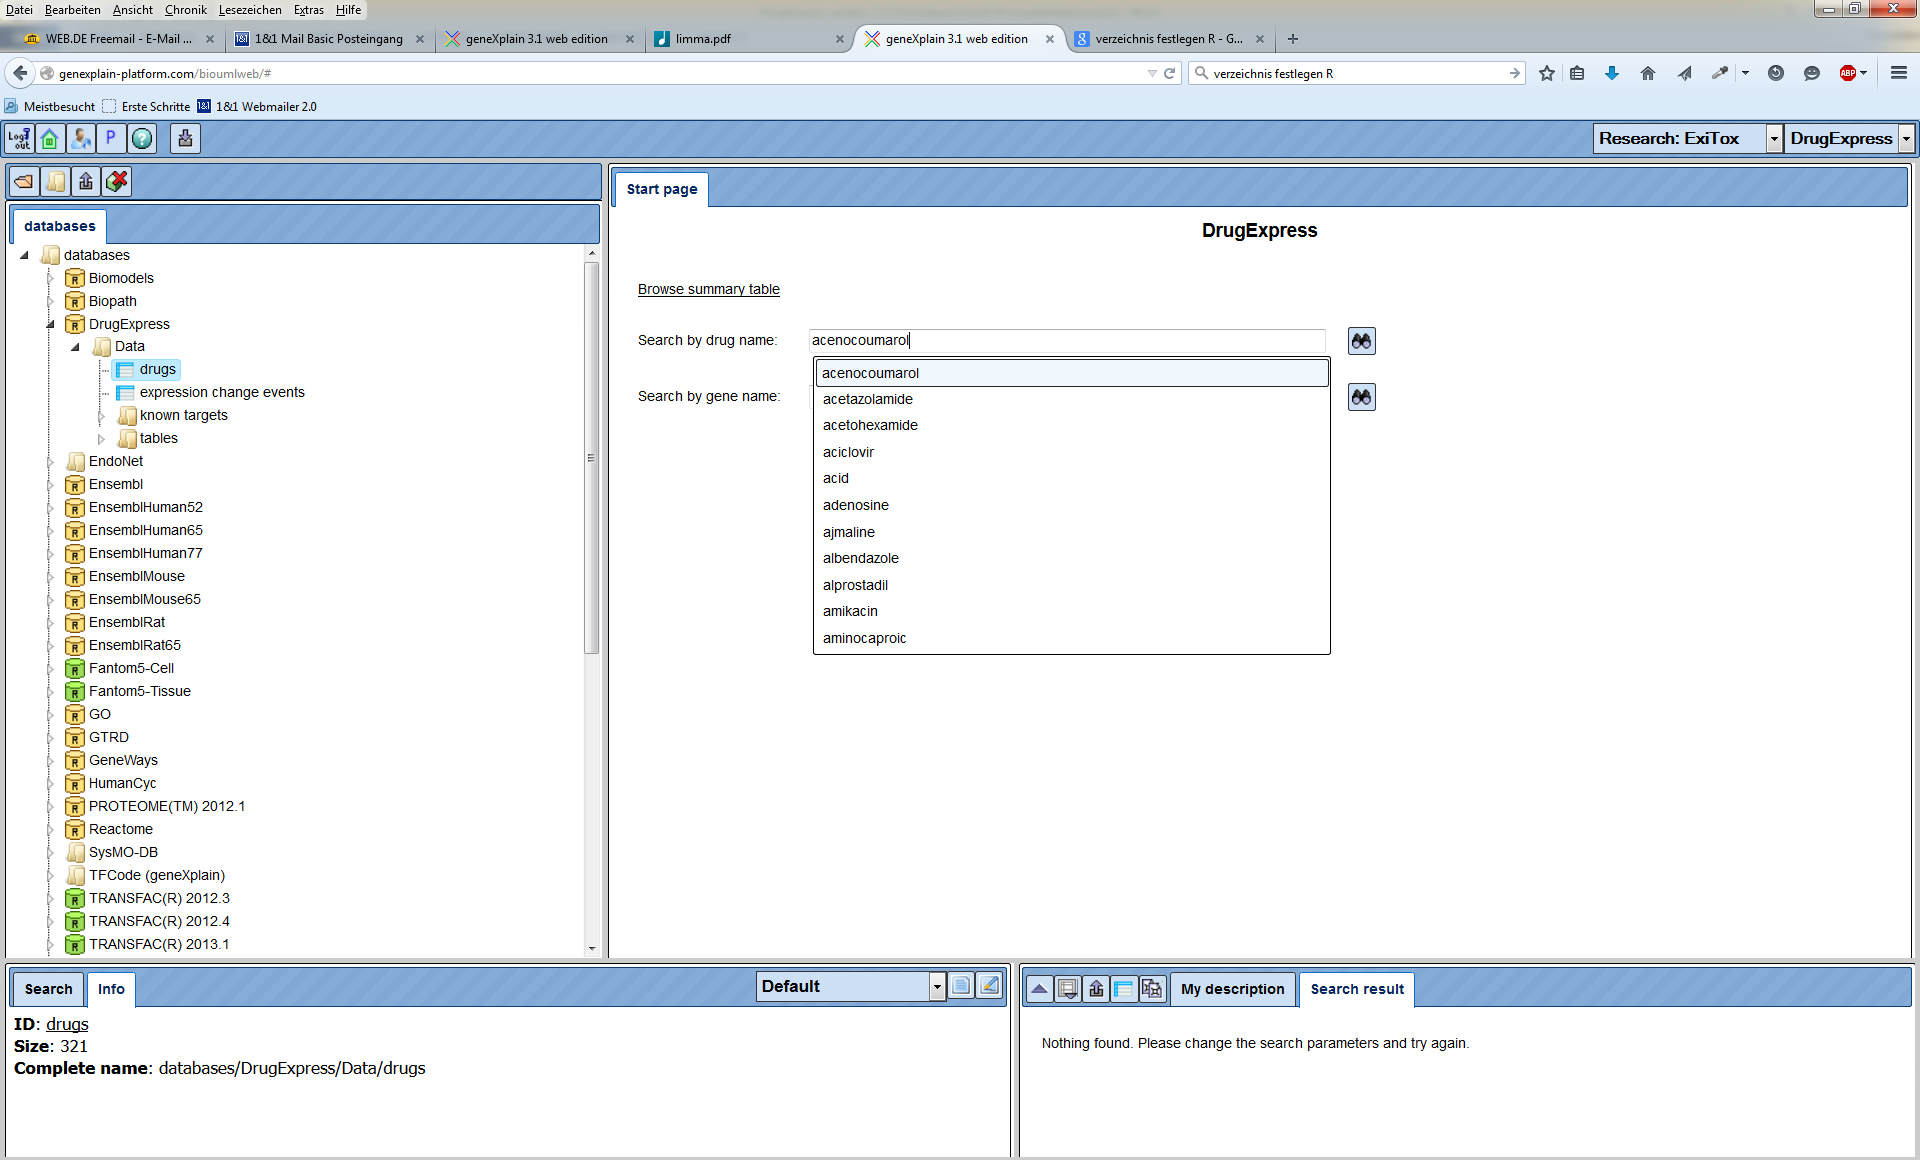
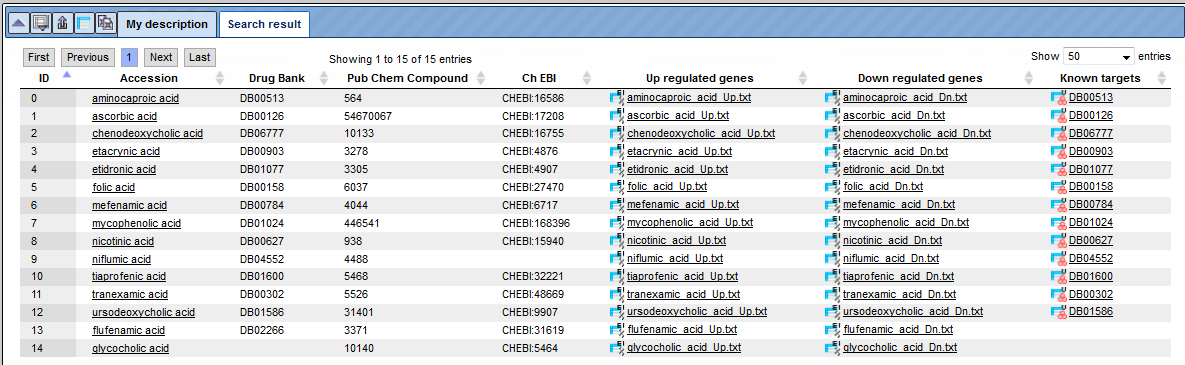
Let’s consider this example. Searching for “acid” returns 15 search results in the database with all columns described above.
To search within the DrugExpress database by the gene name please type in your
search term and press button.
Example. Searching for Caspase10 (casp10) returns 5 entries. The resulting table contains the following columns, the Accession numbers of the linked drug, Drug Name, ENSEMBL Gene Id, Gene Symbol, Affymetrix Id, P_value and the Fold Change of gene expression in the drug treatment experiment.
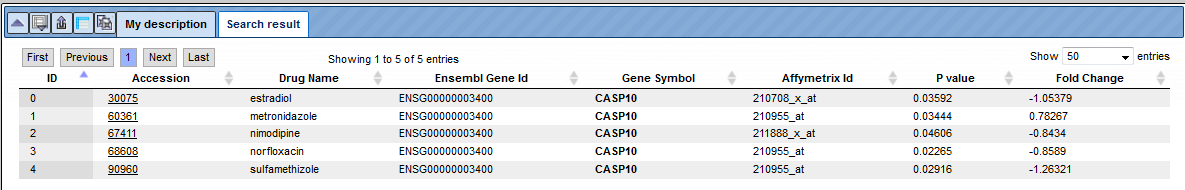
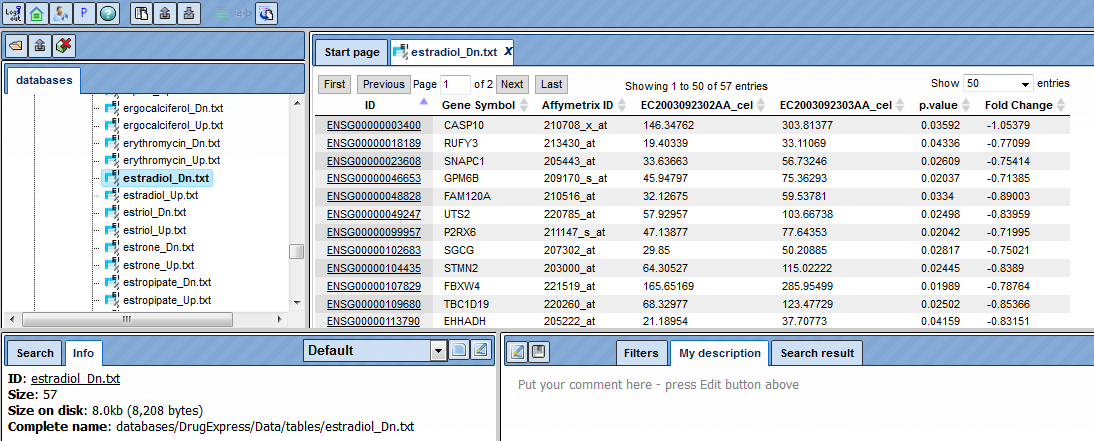
To find out which other genes are regulated in response to the same drug, follow the link from the drug accession number. This opens the whole table with genes that significantly change their expression in response to the treatment.
Functional analysis applying DrugExpress, the input form
The classification of drugs can be also applied to any gene signatures, for example to the genes differentially expressed under certain disease conditions. Mapping of disease-specific gene signatures to the gene signatures of drug responses and the similarities identified may result in intriguing suggestions which drugs can be potentially used for disease treatment.
The DrugExpress dataset can be used by two methods, Functional classification and Enrichment analysis, as a user-specific ontology, the so-called Repository folder. Any input gene or protein table will be classified using the DrugExpress data. 17 subfolders and 642 gene tables will be used as categories for the classification of the input table. We will exemplify this in the following.
Step 1. Open Functional classification analysis, under the tab Analyses, folder Methods, subfolder Functional classification.
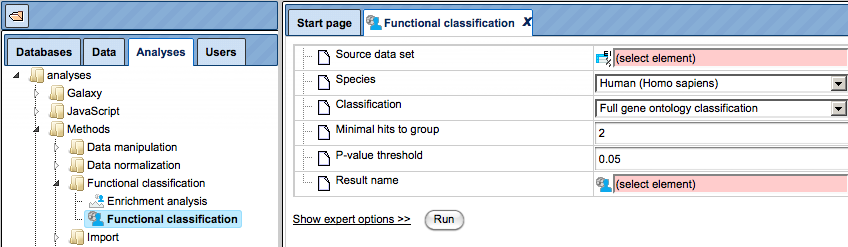
Step 2. Select your input gene table with Ensembl IDs and the corresponding species in the input fields, Source data set and Species, respectively.
Please note that if the table you plan to classify has other IDs, you first need to convert it into a table with Ensembl IDs. This can be done using the Convert table function located at analyses/Methods/Data manipulation/Convert table.
For this example, the following input table is used:
https://platform.genexplain.com/bioumlweb/#de=data/Examples/Brain%20Tumor%20GSE1825%2C%20Affymetrix%20HG-U133A%20microarray/Data/Ewing%20Family%20Tumor%20versus%20Neuroblastoma/Experiment%20normalized%20(RMA)%20(Differentially%20expressed%20genes%20Affy)/Upregulated%20Ensembl%20genes
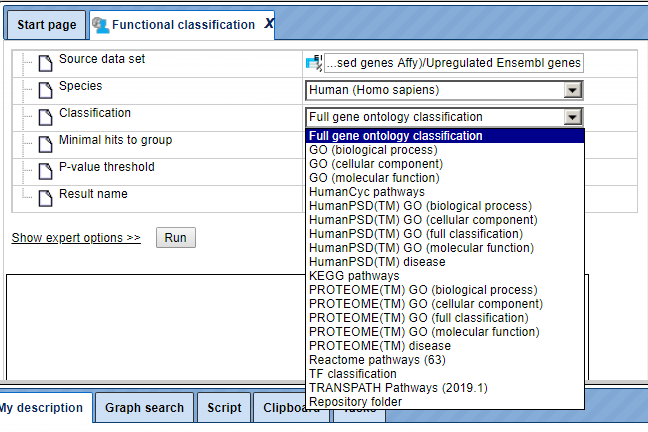
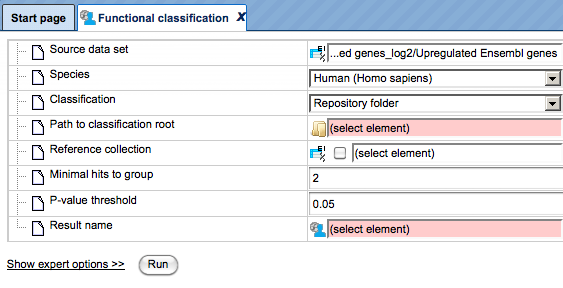
Step 3. In the Classification field, select the option Repository folder from the drop-down menu, as shown below.
Step 4. As soon as the option Repository folder is selected, two additional fields will automatically appear in the input form, Path to classification root and Reference collection. The input form with the added fields is shown below.
Step 5. Mark the DrugExpress folder in the field Path to classification root.
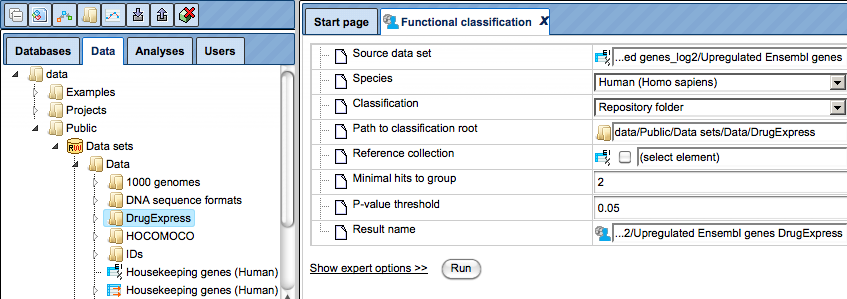
Step 6. Leave the fields Minimal hits to group and P-value threshold as per default, and specify location and name for the output table in the field Result name.
Step 7. Press the [Run] button and wait till the analysis is completed.
Results of the functional classification using DrugExpress
As a result, a table is generated with all columns as usual for Functional classification results, shown below. You can find the resulting table at:
https://platform.genexplain.com/bioumlweb/#de=data/Examples/Brain%20Tumor%20GSE1825%2C%20Affymetrix%20HG-U133A%20microarray/Data/Ewing%20Family%20Tumor%20versus%20Neuroblastoma/Upregulated%20Ensembl%20genes%20DrugExpress
Each row corresponds to one ontological category, which in this case is one of the subfolders or tables from the DrugExpress folder*.* The names of the tables and subfolders are shown in the ID column. For each row several parameters are calculated, including the expected number of hits, actual number of hits, p-values, as well as hit names.
All IDs are internally hyperlinked, and with a click on each name the corresponding gene table will be opened.
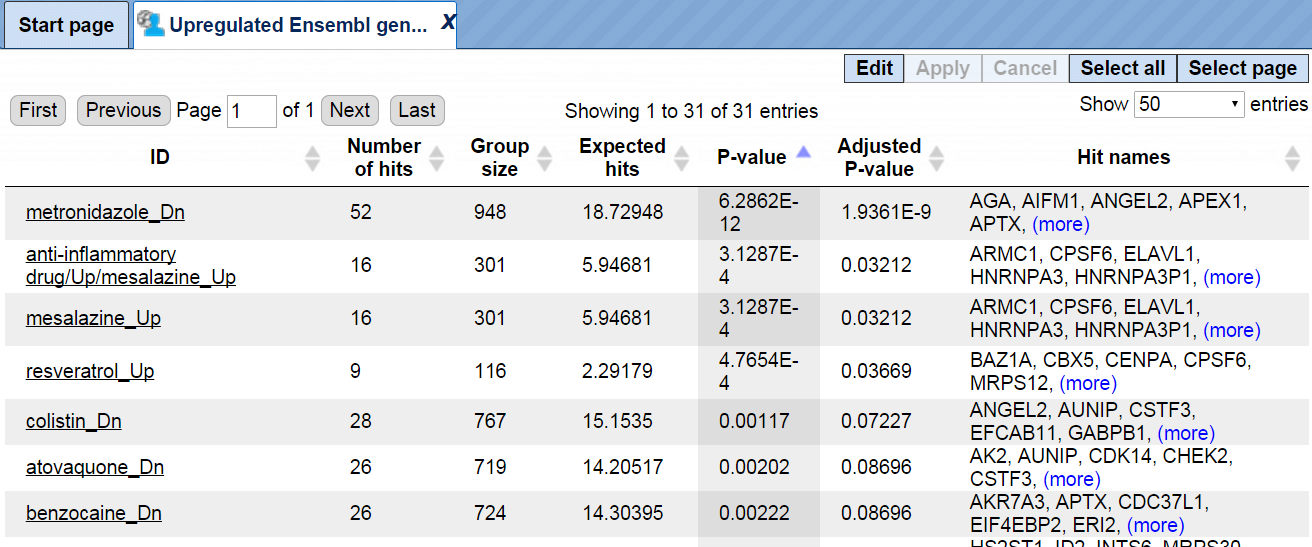
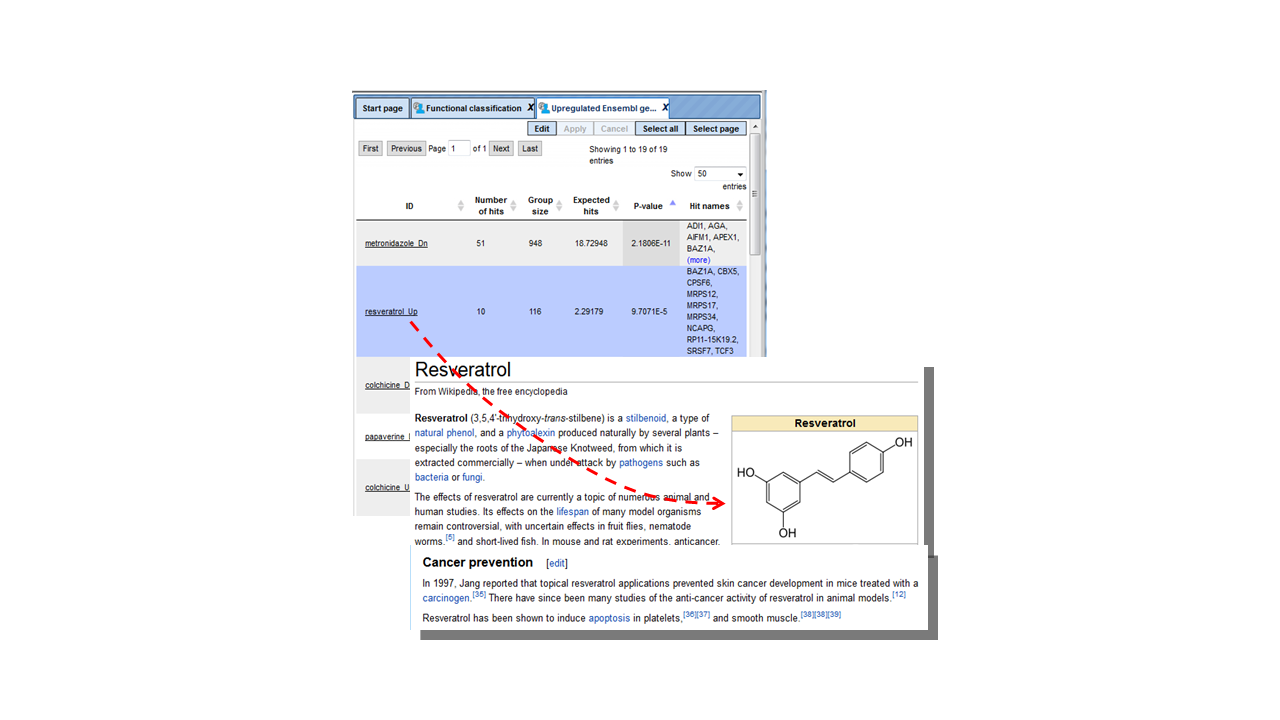
For this example, we classified genes up-regulated in the Ewing brain tumor versus neuroblastoma, using DrugExpress gene signatures. Each resulting line identifies a statistically significant similarity of genes up-regulated in Ewing brain tumor versus neuroblastoma, with the gene signature in response to a given drug or chemical substance. For example, 52 genes from the input list are classified into the group metronidazole Dn, which means that these 52 genes are known to be down-regulated by metronidazole; the p-value of this classification is 6.2862E-12. In the next lines, 9 genes from the input list are classified into the group resveratrol Up, which means these 9 genes are known to be up-regulated by resveratrol; the p-value of this classification is 4.7654E-4 This might be an interesting hint, because resveratrol has a potential anticancer activity.
Tip. Any user-created ontology or collection of tables can be used for the classification of input gene lists, in a similar way as it has been shown for DrugExpress. To do this, you need to create a corresponding folder in your project, which can contain a hierarchy of subfolders as well. Importantly, each table in such a folder should have Ensembl IDs. Each subfolder and individual table will be used as a separate classification category, and will result in a separate line in the resulting table. | |