miRNA
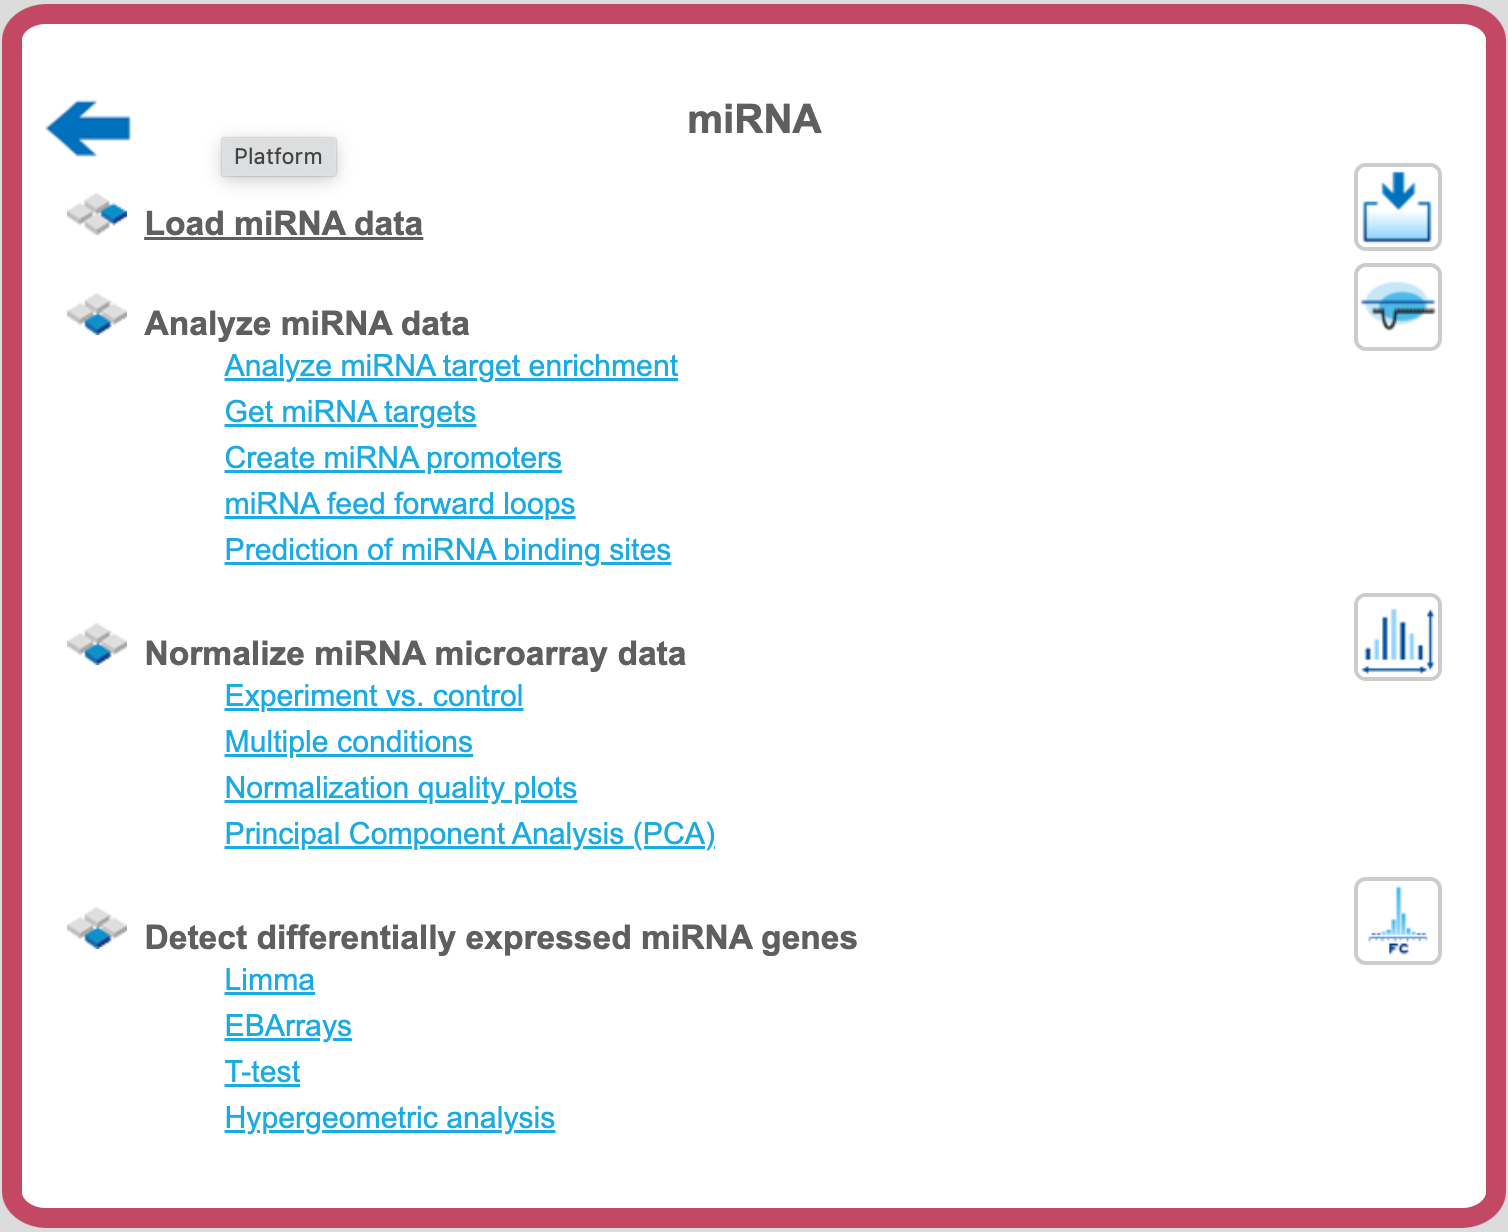
When you open this Area, a list of workflows optimized for working with microRNA data will show up, which looks as follows:
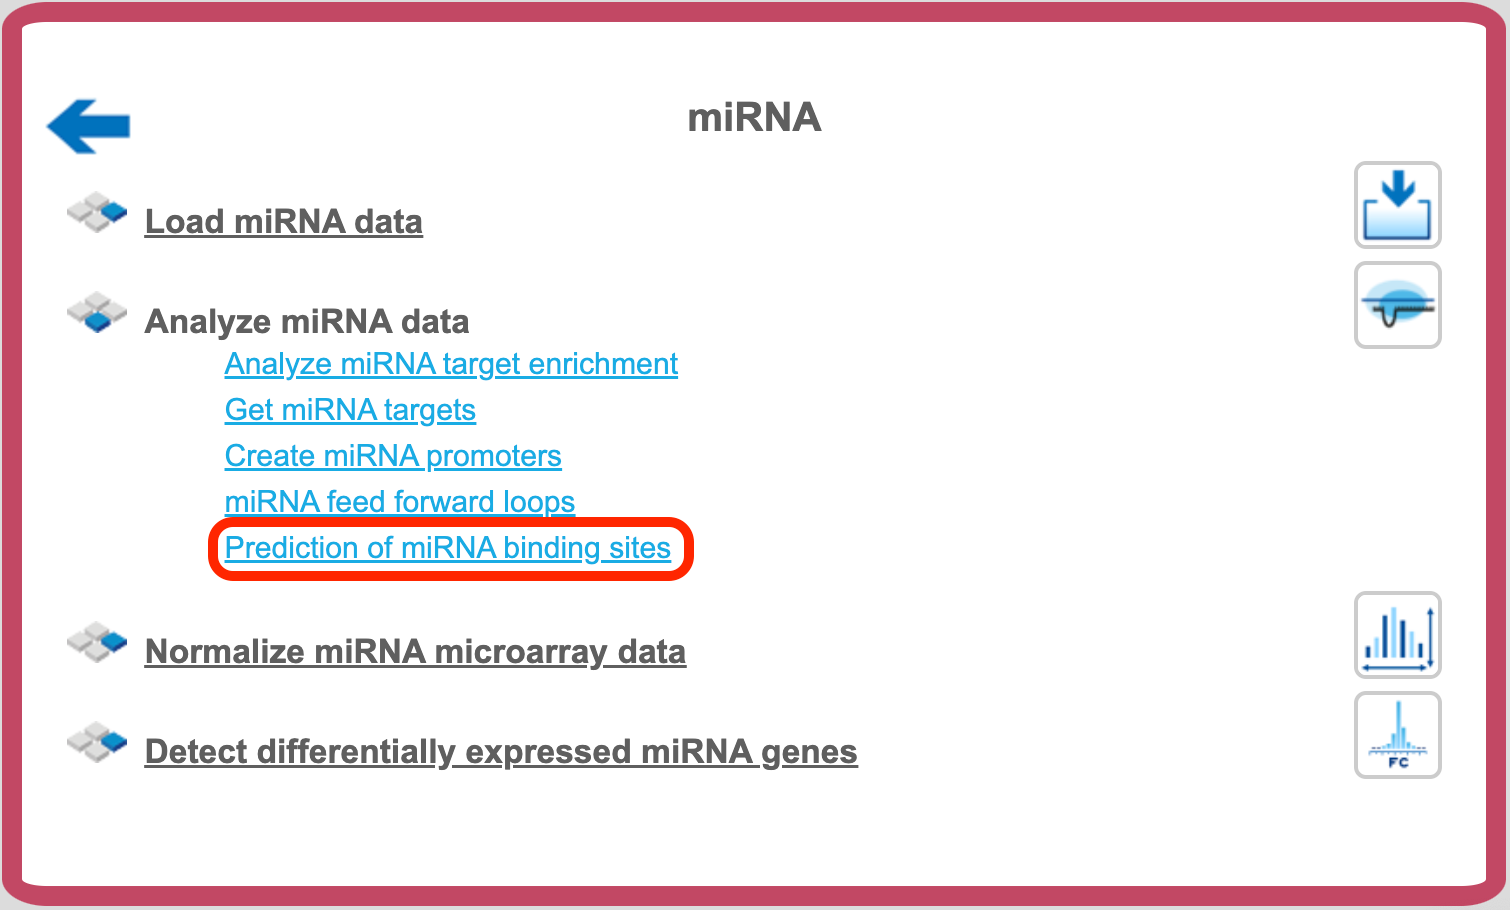
Prediction of miRNA binding sites
MicroRNAs, or miRNAs, post-transcriptionally affect (mostly repress) the expression of protein-coding genes. The human genome encodes over 1000 miRNA genes that collectively target the vast majority of messenger RNAs (mRNAs). This workflow can help to predict miRNA binding sites. Starting from a gene list, first a collection of 3’ untranslated regions (3’ UTRs) is created. This collection is used to map against a miRmap library, which is derived from the mirBase database (release 20; http://www.mirbase.org). The last step of the workflow is based on the miRmap method (analyses/Galaxy/microRNA/mirmap; http://mirmap.ezlab.org*)*, published by Vejnar & Zdobnov, Nucleic Acids Res. 40:11673-11683, 2012. The result of the workflow is a table with all predicted miRNA binding sites and a track for visualization in the created sequence collection. The workflow can be found on the Start page via the miRNA button.
To launch the workflow, follow these steps:
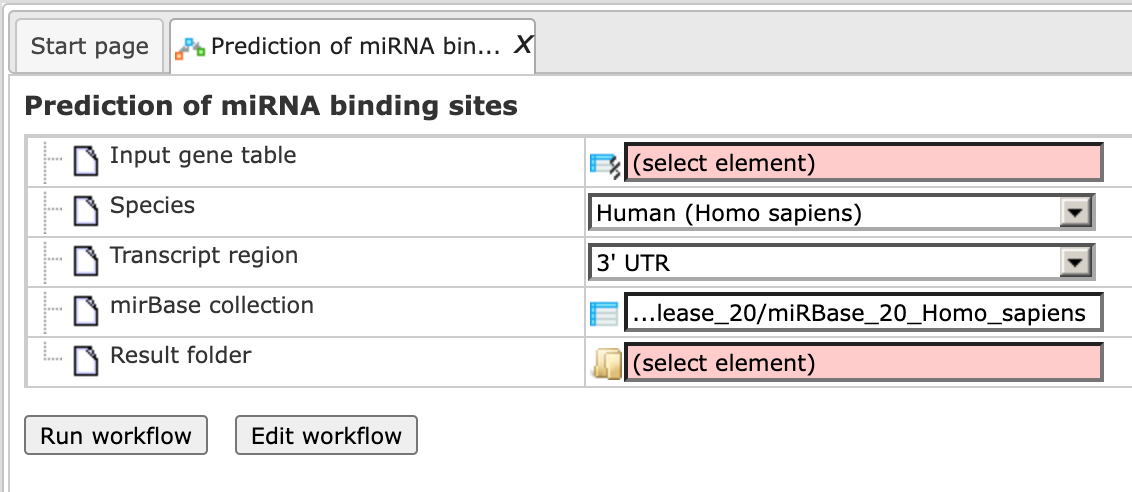
Step 1. Open the workflow input form from the Start page. It looks as shown below:
Step 2. Specify the input gene table. The input gene sets might be lists of differentially regulated genes or any gene or protein list of interest. You can drag them from your project within the tree area and drop them in the pink box of the field Input table. Alternatively, you may click on the pink field “select element” and a new window will be opened, where you can select the input gene set as shown below.
The further steps of the workflow are demonstrated on the example file, which can be found here.
This table contains four genes that are already published targets for one particular miRNA, hsa-miR-155-5p, for which several target genes have been published as well; we have derived this information from the TRANSFAC® database.
Step 3. Specify the biological species of the input set in the field Species by selecting it from the drop-down menu.
Step 4. In the field Transcript region, choose the gene region from the drop-down menu. Here, the 3’ UTR is selected as default with a fixed length of 300bp. The CDS information is ignored.
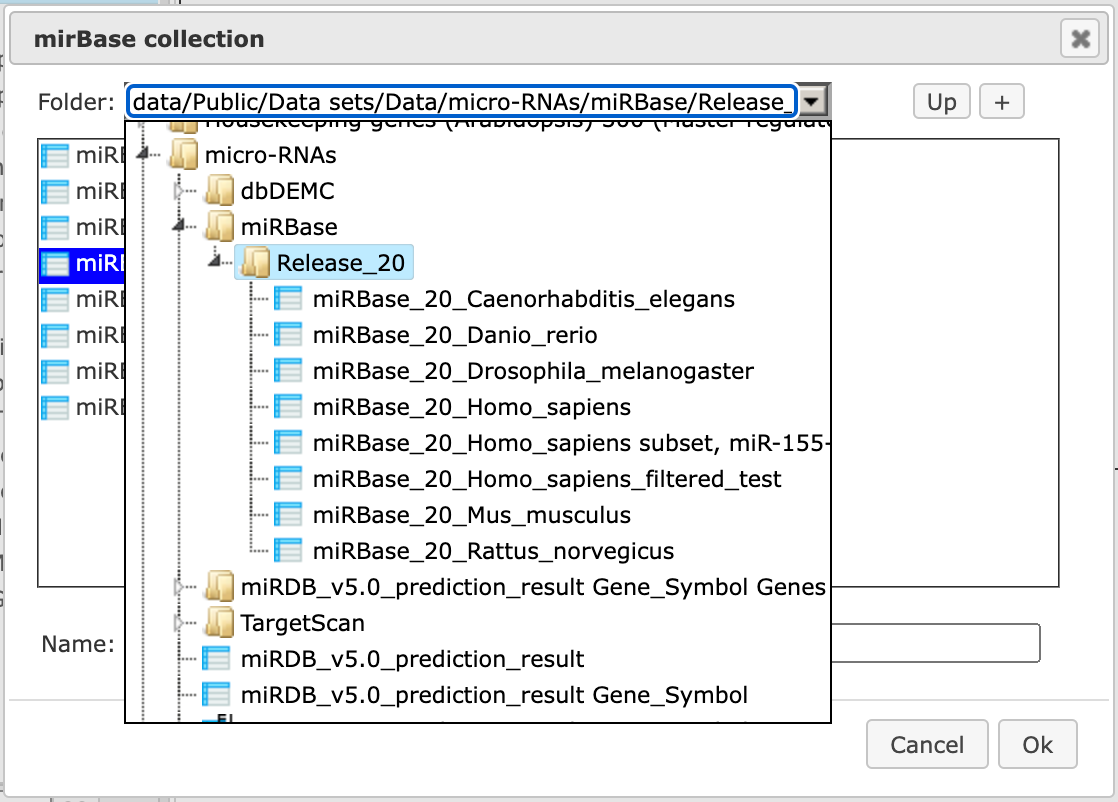
Step 5. Selection of miRBASE collection. By clicking in this field, six different miRBase collections from release 20 are available for Homo sapiens, Mus musculus, Rattus norvegicus, Drosophila melanogaster, Danio rerio and Caenorhabditis elegans.
The miRBase library can be opened as a table as shown below.
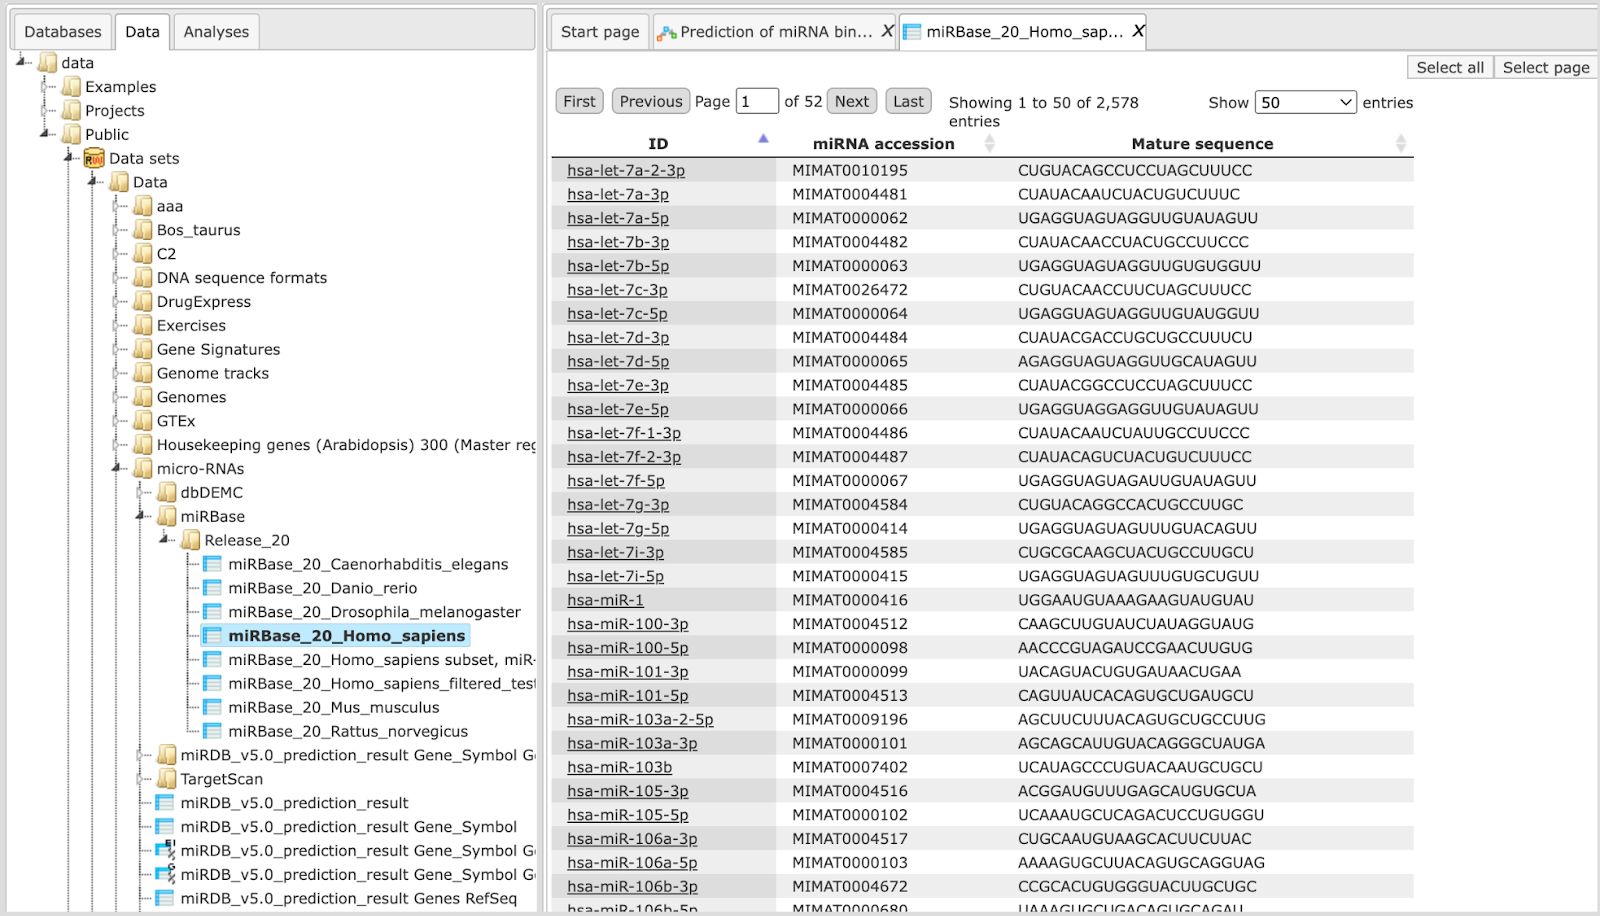
The miRBase library table has three columns for each miRNA. Identifiers in the column ID are hyperlinked to miRBase (http://www.mirbase.org/). Two other columns are the miRNA accession numbers and the mature sequence, which is used for binding site identification.
You can use the whole library or you can create a subset of several or even just one miRNA of interest to focus on predicting binding sites for this particular miRNA.
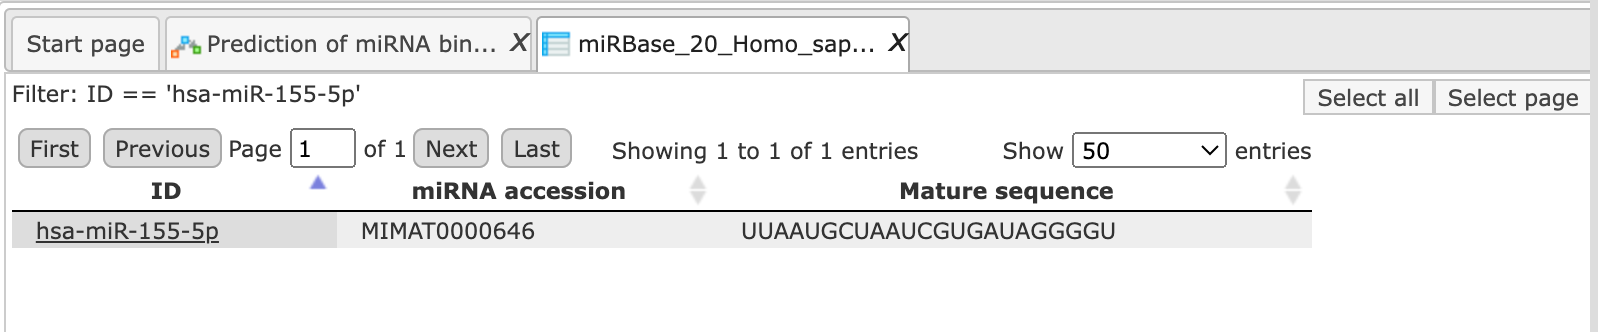
In this example, let’s create a subset containing just one miRNA,
hsa-miR-155-5p, for which several target genes have been already published. To
create a subset from the table, apply the Filter tab in the operations field. We used filter: ID == 'hsa-miR-155-5p' The resulting customized miRBase contains just one row.
Step 6. Define where the folder with the results should be located in the tree. You can do so by clicking on the pink field select element in the field Result folder, and a new window will be opened, where you can select the location of the result folder and define its name.
Step 7. Press the [Run workflow] button.
When the workflow is completed, the result folder is opened by default.
Results
Output folder is found here.
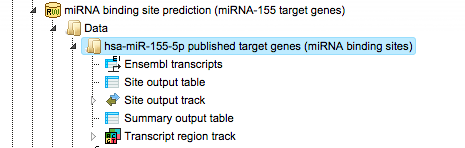
The result folder contains the following tables: Ensembl transcript ( ),
Site output and summary output tables(
),
Site output and summary output tables( ), Site output track (
 )
for visualization of predicted miRNA sites, and Transcript region track
)
for visualization of predicted miRNA sites, and Transcript region track 
The table Ensembl transcripts corresponds to the input gene table converted to the Ensembl transcript IDs (first column ID). The other columns of this table are the same as they are in the input table. In this example, 4 Ensembl genes are converted into 26 Ensembl transcripts.
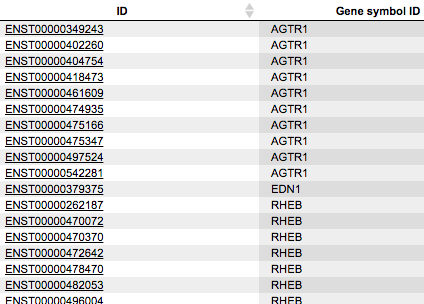
These Ensembl transcript IDs are needed to construct the Transcript region track, in this workflow especially containing 3’ UTRs of genes given in the input table. The workflow takes 300 bp regions as 3’ UTRs.
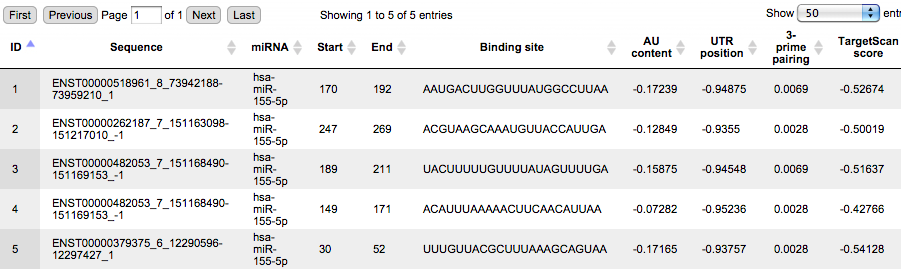
The Site output table contains all identified miRNA binding sites; each row in this table corresponds to one identified miRNA binding site, and each site/row has an ID assigned. The column Sequence corresponds to the 300 bp 3’ UTR of the indicated Ensembl transcript, where the search for miRNA sites has been done. The column miRNA contains the name of miRNA binding to this site, in this example hsa-miR-155-5p. The columns Start and End are positions within the input sequence and the column Binding site contains the sequence of the site.
The Site output track enables the visualization of the predicted sites in
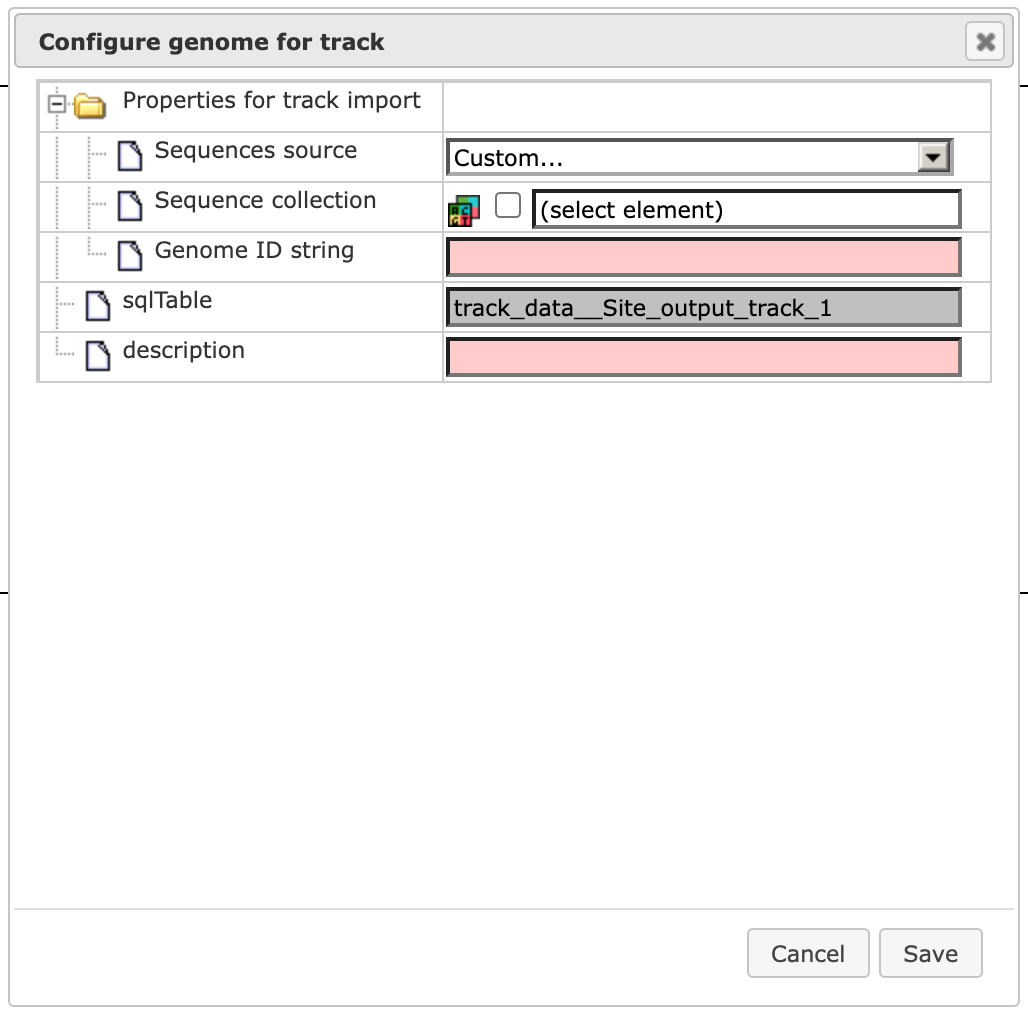
the 3’ UTRs of the input gene list. With a double-click on ( ) in the results folder, the dialog box Configure genome for track is opened.
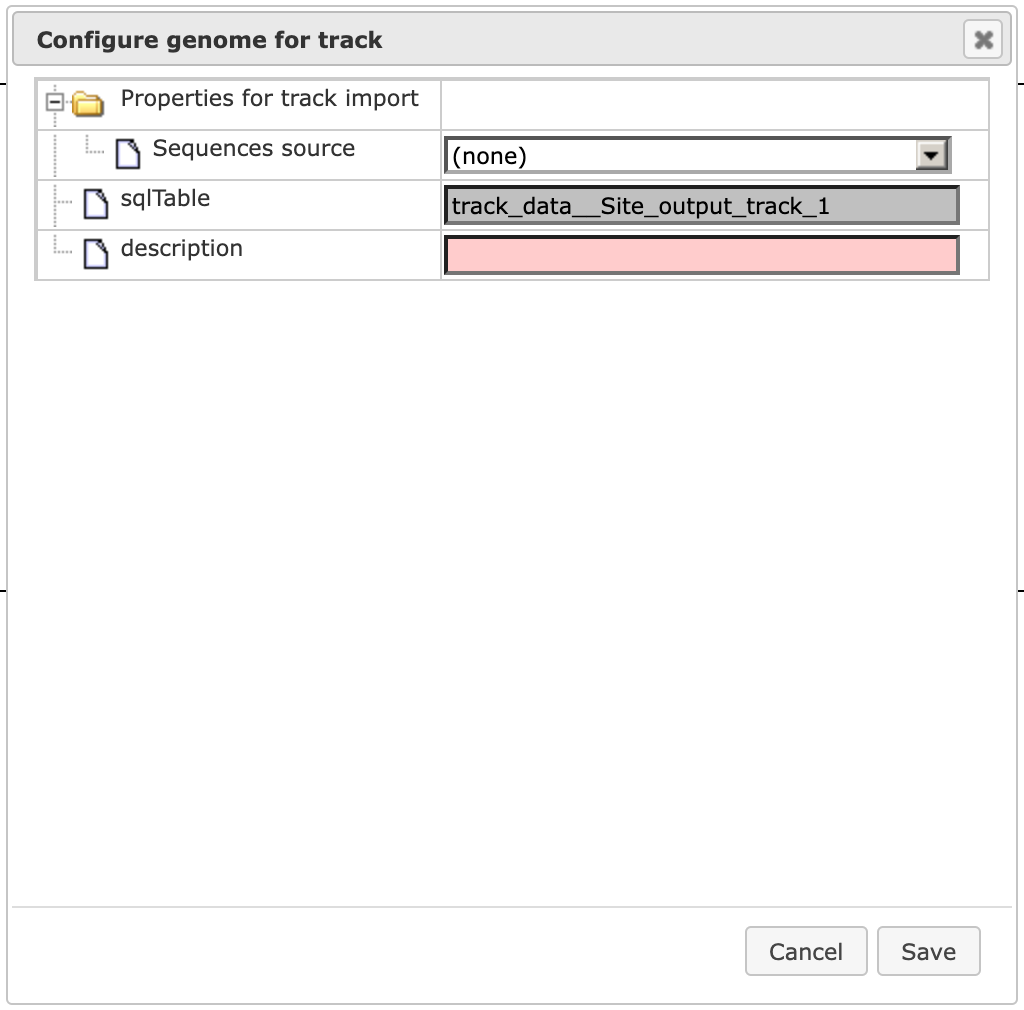
Within this dialog box, first set the field Sequence source to Custom…
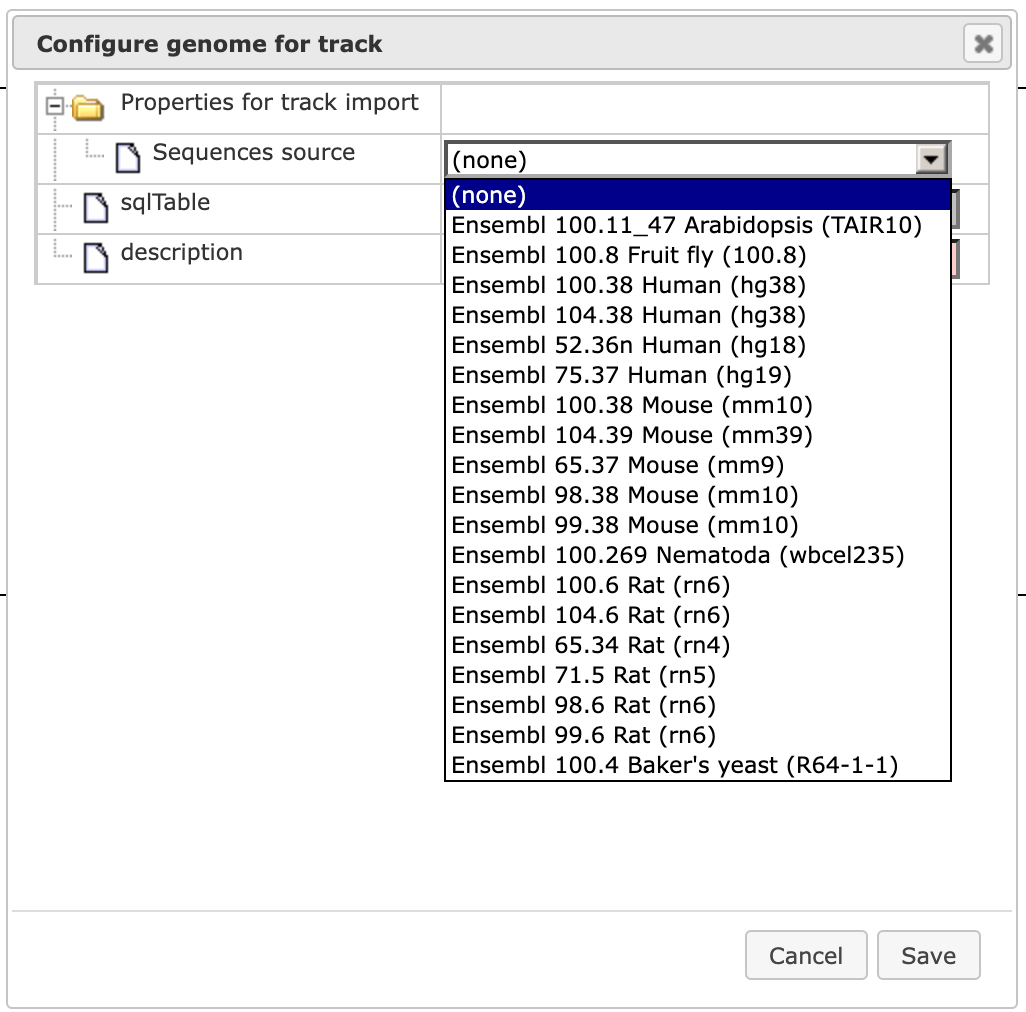
and [Save] it. The dialog box is automatically adjusted, and the field Sequence collection becomes available.
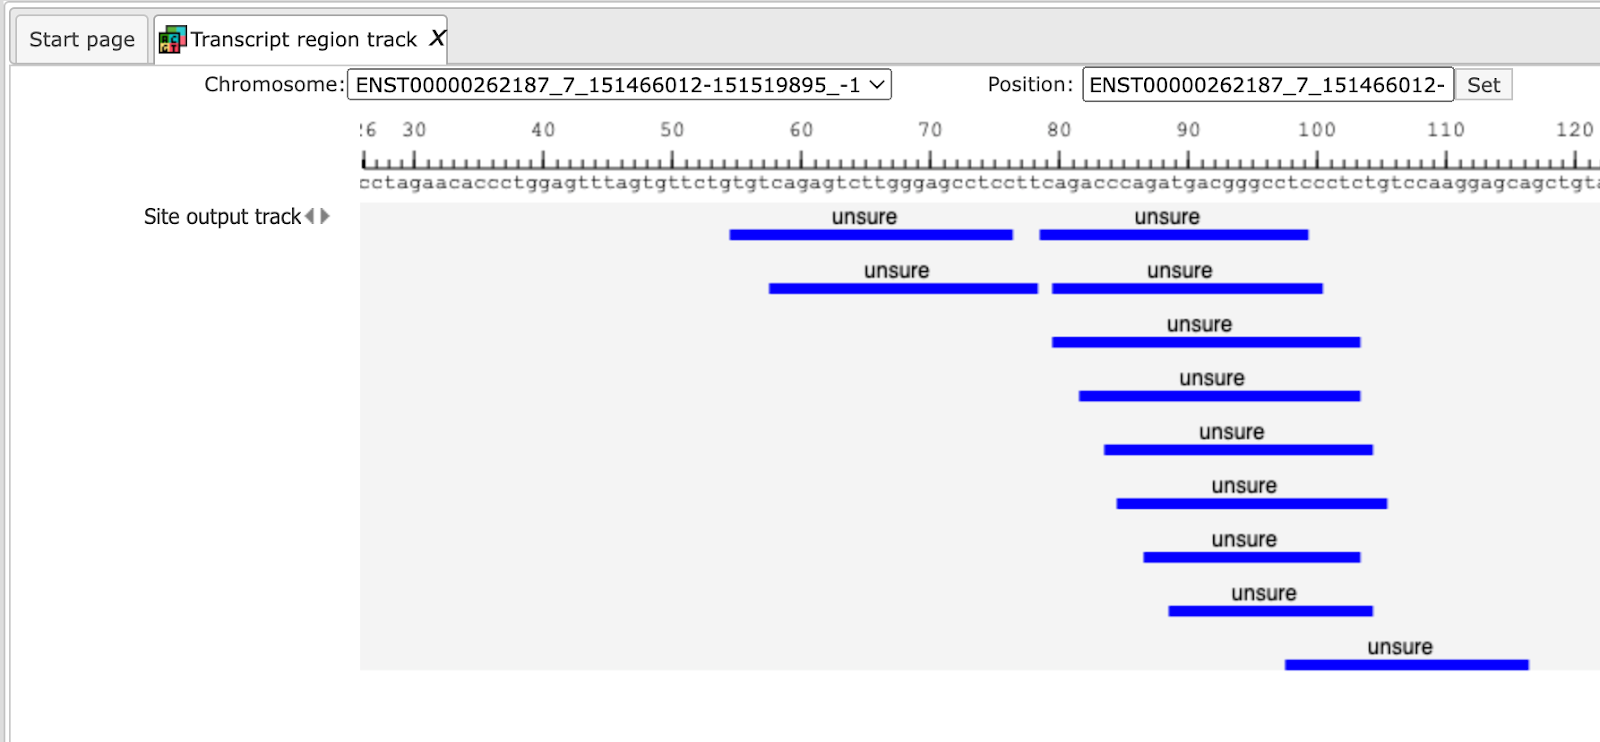
You can drag and drop the sequence collection Transcript region track from the workflow results folder and [Save] it. The visualization is opened automatically in the work area.
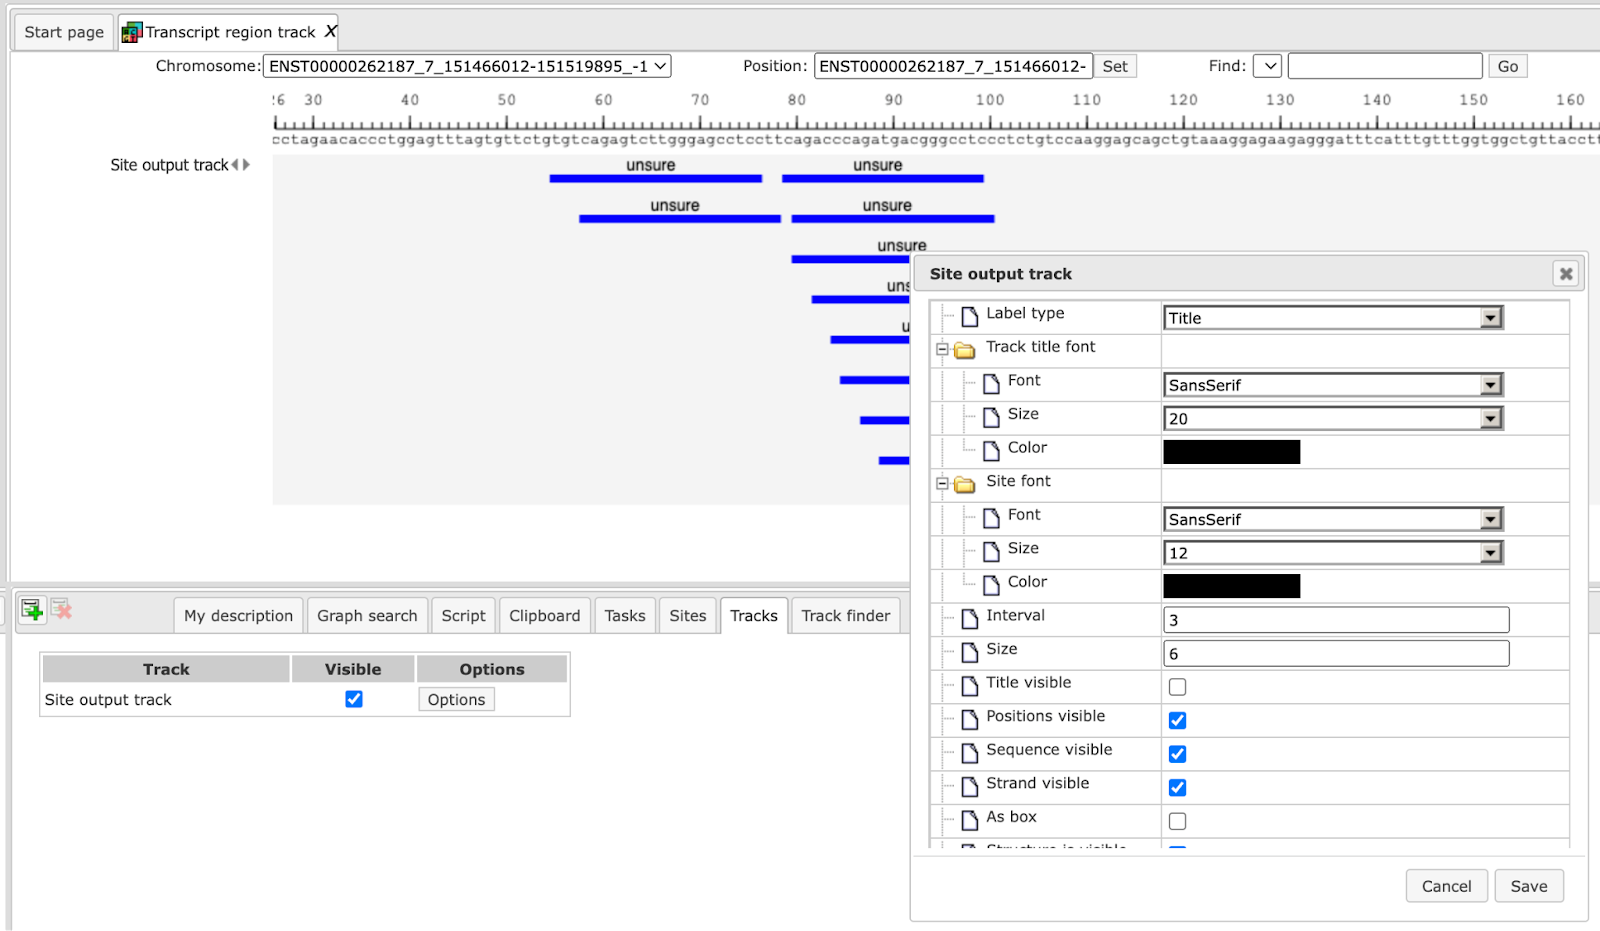
You can modify visualization settings by opening the tab Tracks in the Operations Field, highlighted by the red boxes on the screenshot above, and press the button [Options]. The dialog box Site output track will be opened. You can modify different settings according to your preferences and [Save] them. Here, the settings in the highlighted check-boxes were changed as shown below.
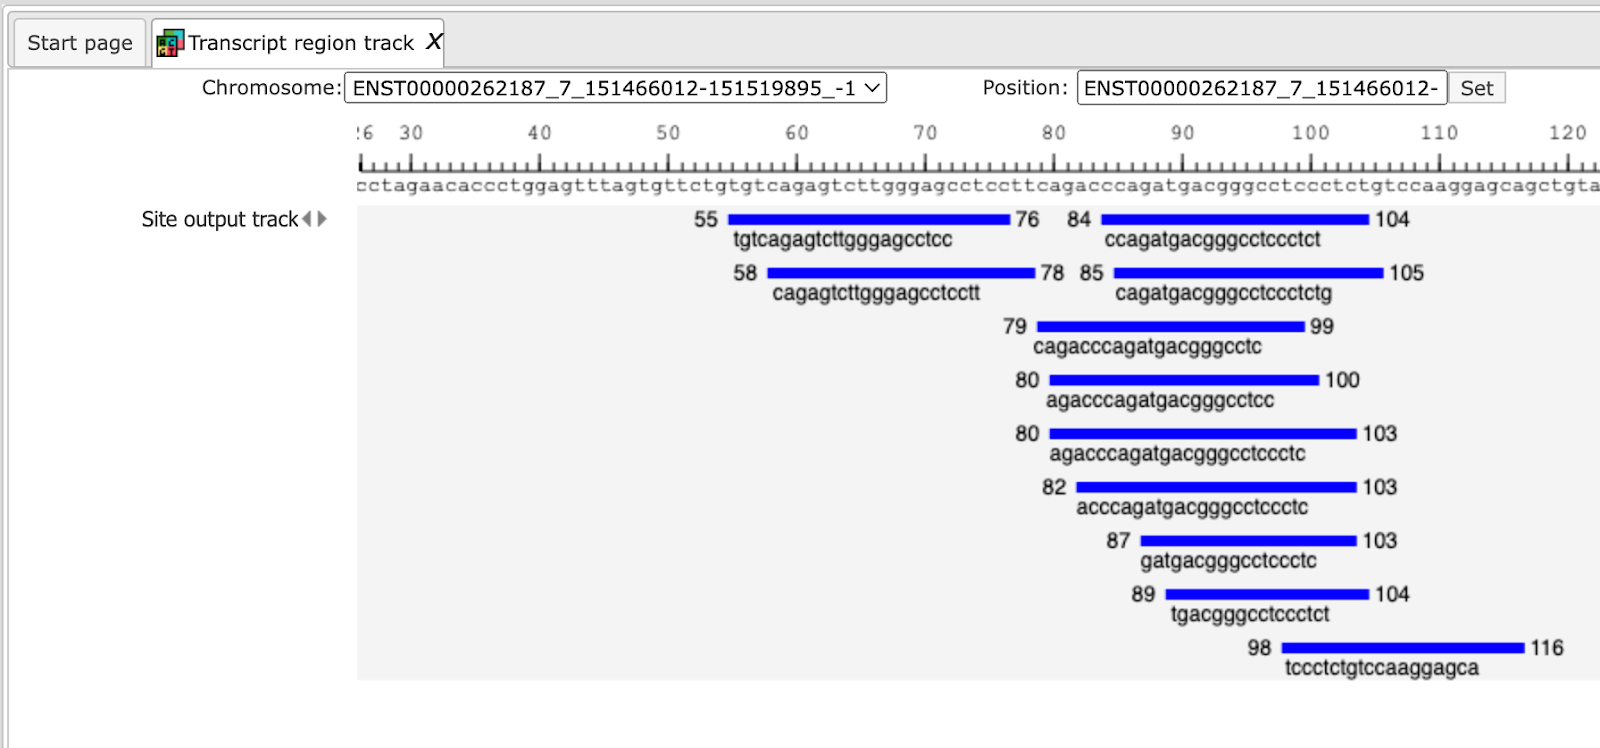
These changes resulted in the following visualization.
The Summary output table presents those transcripts where miRNA binding sites are identified, in this example four transcripts.
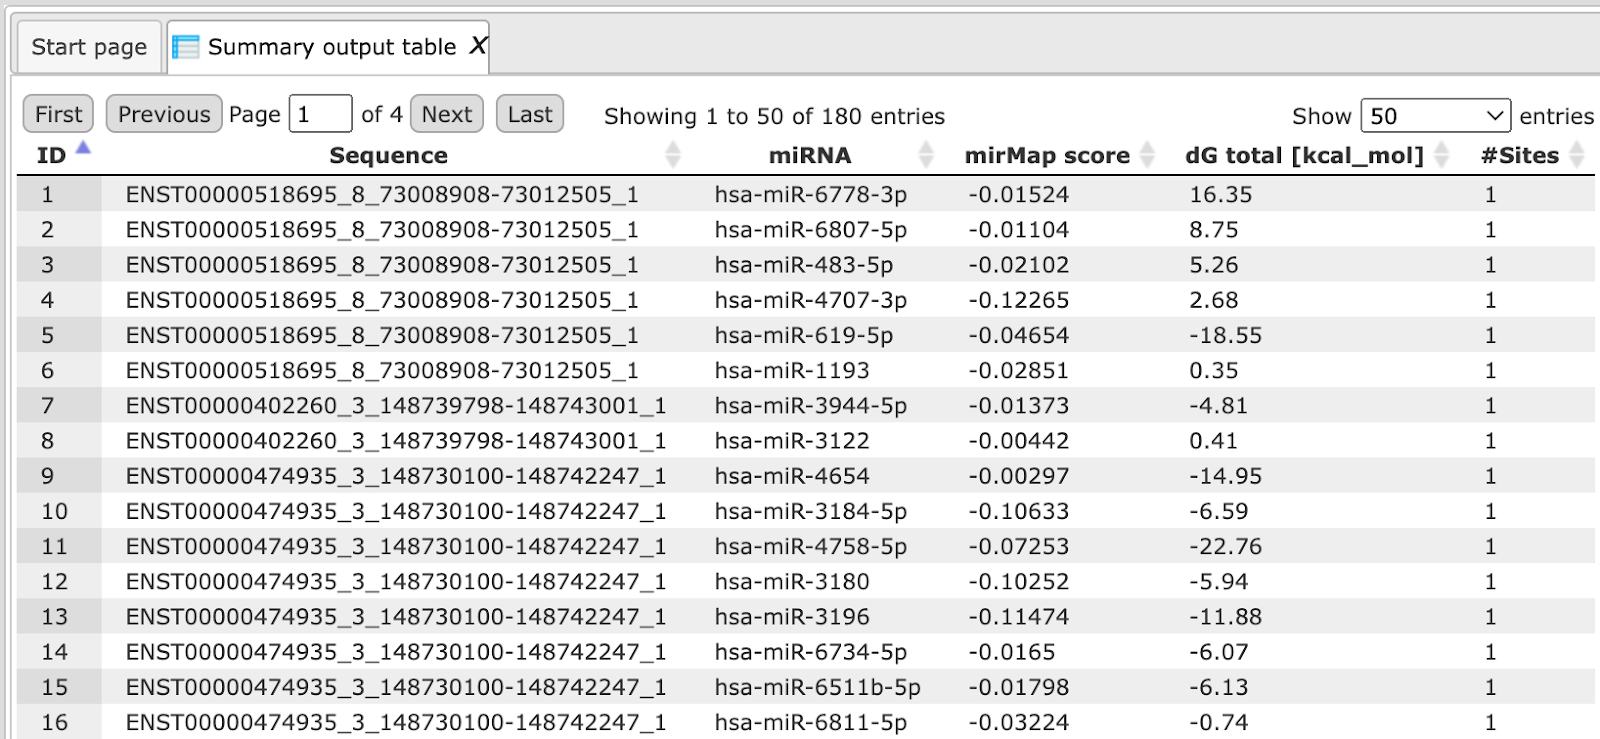
Each row corresponds to one transcript. The column Sequence contains the titles of the Ensembl transcripts, and the column miRNA presents the name of the miRNA. The number of binding sites for a particular miRNA in each transcript is shown in the column #Sites.