Drug targets
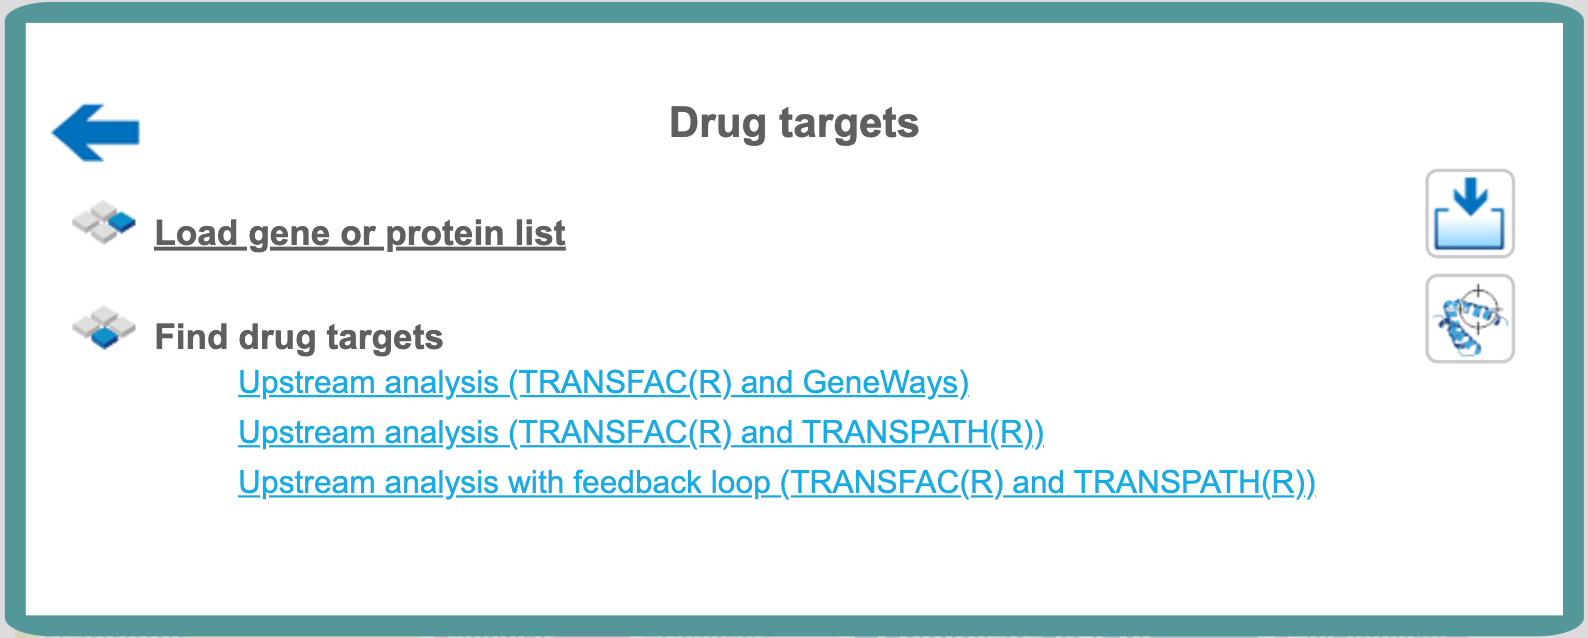
Find drug targets with TRANSFAC® and GeneWays
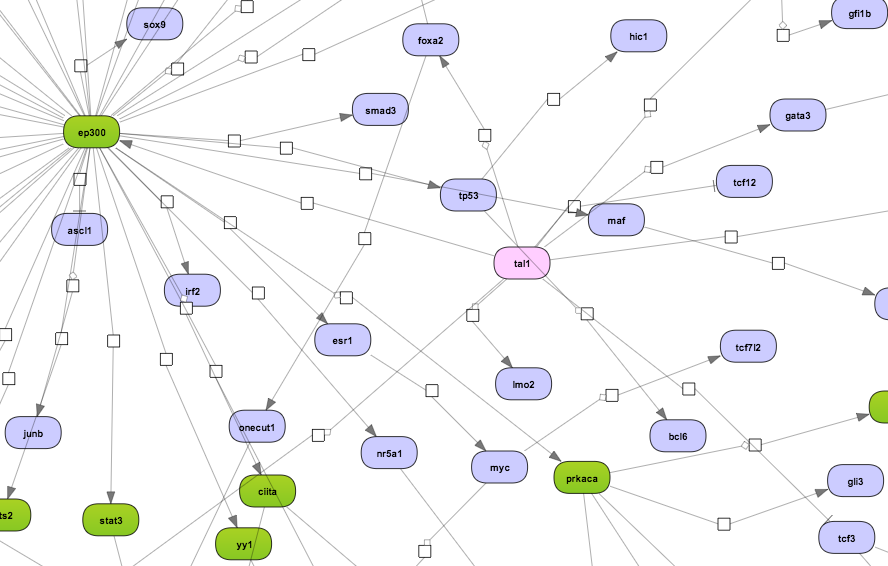
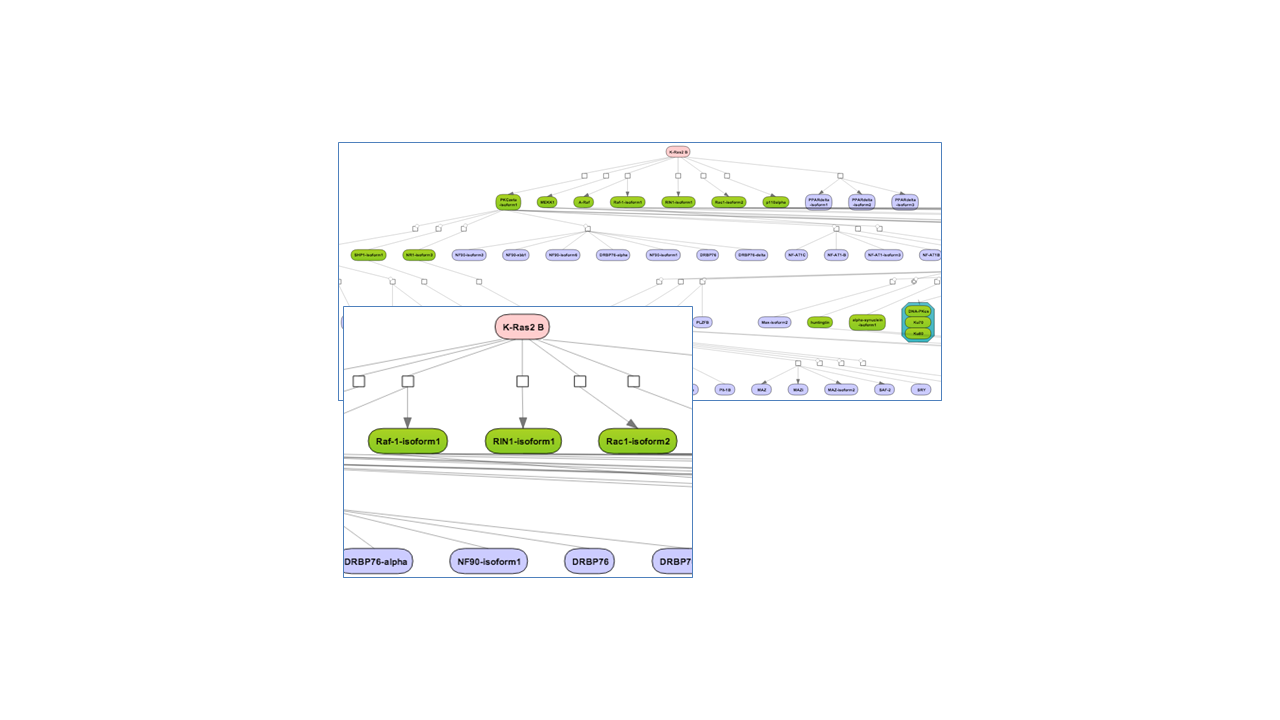
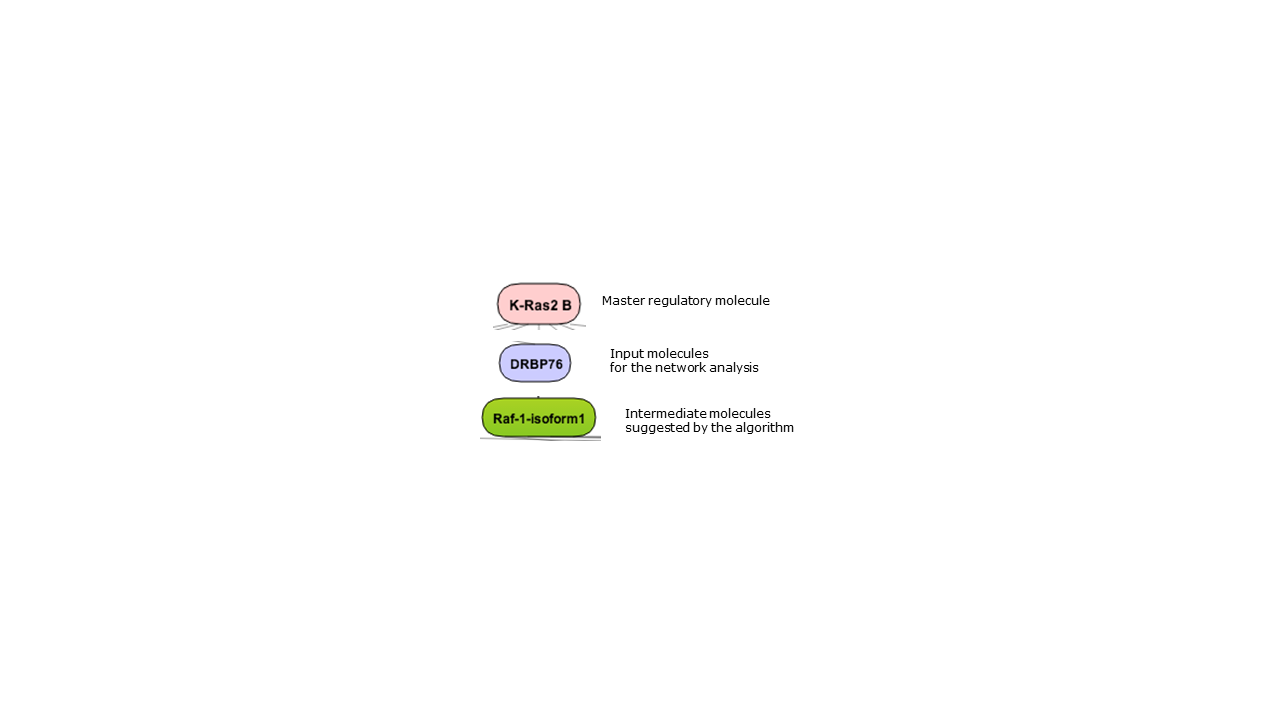
This is very similar to the workflow described in greater detail below with the only difference being the pathway database applied for network analysis. Here the search for master regulatory molecules is performed with the protein-protein interaction network of the GeneWays database. Because of the high connectivity between molecules in GeneWays, by default 4 steps upstream of the input list of TFs are considered for the search for master regulators, as compared with 10 steps when applying the TRANSPATH® database. A diagram for the top master regulator as suggested from a GeneWays-based analysis is shown below in a force-directed layout:
For the input form of this workflow and for the description of the corresponding results folder, please refer to the description of the workflow Find drug targets with TRANSFAC and TRANSPATH.
Note*.* This workflow is available together with a valid TRANSFAC® license. Please feel free to ask for details (info@genexplain.com).
Find drug targets with TRANSFAC® and TRANSPATH®
The geneXplain upstream analysis is an integrated promoter (TRANSFAC®) and pathway (TRANSPATH®) analysis to discover unanticipated causal relationships in your data.
Upstream analysis (TRANSFAC® and TRANSPATH®)
To launch the workflow, open the workflow input form from the Start page:
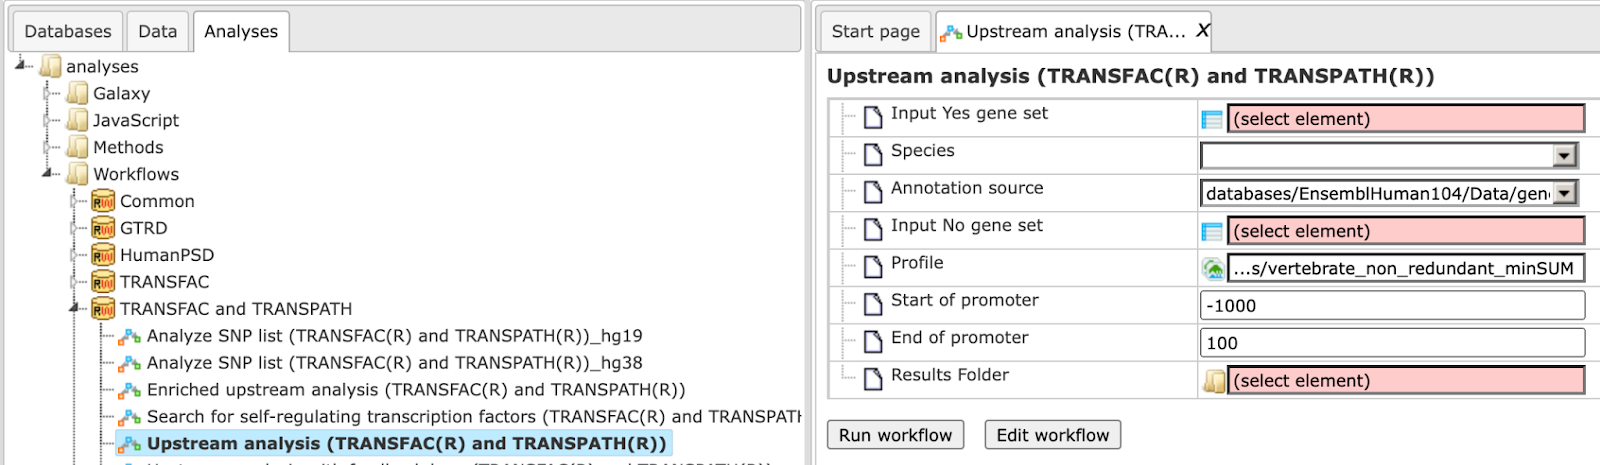
Step 1: Specify a gene set under study, e.g. a list of differentially regulated genes, as the Input Yes gene set. You can drag & drop it from your project within the Tree Area and drop in the pink box of the field Input gene set.
For this example, the further steps are demonstrated with the following input set: https://platform.genexplain.com/bioumlweb/#de=data/Examples/User%20Guide/Data/Input%20for%20examples/workflows/Upregulated_top100
Step 2: Specify the biological species of the input set in the field Species by selecting the required species from the drop-down menu.
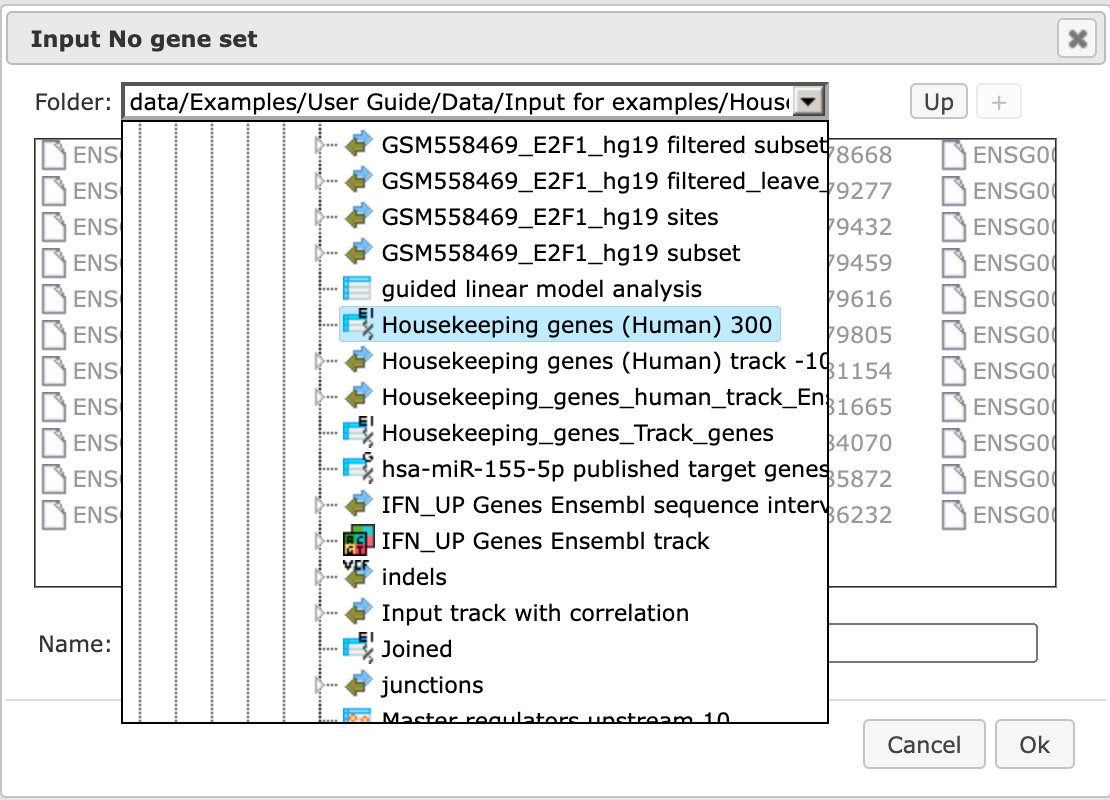
Step 3: Input a No gene set. This is the set of background genes or control set. The default No set used for this workflow is data/Examples/Sample data/Data/Housekeeping genes (Human). If your Yes set is from mouse or rat, you may wish to adjust the No set accordingly. With a mouse click on the field Input No gene set, a pop-up window will be opened as shown below. You can select mouse or rat housekeeping genes from these pre-compiled sample sets, or you can alternatively select any of your specific gene sets from your project. When selection is done, press [Ok].
Step 4: Define a TRANSFAC® profile. The default profile is vertebrate_non_redundant_minSUM. Any other TRANSFAC® profile or user-specific profile can be chosen. With a mouse click on the field Profile, a pop-up window will open, where a profile can be selected.
Step 5: Define the promoter regions to be analyzed. The default promoter region is from-1000 to 100 relative to the TSS as annotated in the Ensembl database. You can adjust Start of promoter and End of promoter by typing in the corresponding fields.
Step 6: Define where the folder with the results should be located in your project tree. You can do so by clicking on the pink box (select element) in the field Results folder, and a new window will open, where you can select the location of the results folder and define its name.
Step 7: Press the [Run workflow] button. Wait until the workflow is completed, and take a look at the Upstream Analysis results
Visualization and interpretation of results
Master regulators
The primary result table Master regulators upstream 10 is a list of master regulatory molecules that were identified at a distance of up to 10 steps upstream of the input TFs. Each master regulatory molecule is characterized by a Score, Z-score, FDR, and Ranks Sum.
)
The selection of the best master regulatory molecules based on Score, Z-score and Ranks sum is explained in there under “Interpretation of the results”.
The three Top 3 regulators diagrams ( )visualize the networks for each of the three top master regulators. By default, the top regulators are identified upon sorting the Master regulators upstream
10 table (
)visualize the networks for each of the three top master regulators. By default, the top regulators are identified upon sorting the Master regulators upstream
10 table ( ) by the column Ranks sum with the lowest rank on top.
Tip for working with the diagrams
By default, network diagrams are shown in the vertical hierarchical layout. The layout can be interactively changed into horizontal hierarchical, or force directed, or orthogonal layouts as described in diagram layouts. Expression data can be mapped on the diagrams as described in the expression mapping section.
Results of the promoter analysis
Along with the master regulatory molecules, this workflow returns the results of the promoter analysis, including TFBSs enriched in the promoters of the Yes set as compared with the No set, see summary ( ). The tracks with the Yes and No promoters and with the TF binding sites (
 ) are also included in the output.
Note*.* This workflow is available together with valid TRANSFAC® and TRANSPATH® licenses. Please feel free to ask for details (info@genexplain.com).
Upstream analysis with feedback loop
This workflow enables a complete upstream analysis, detecting enriched transcription factor binding sites and resulting in the identification of master regulators upstream from the transcriptional regulators. Some master regulators with expression values (fold changes) from the input set are identified (with feedback loop). The results of this workflow include master regulators from all transcription factors and master regulators only with expression values from the input set (=feedback loop). To launch the workflow, open the workflow input form from the Start page:
Step 1: Specify a gene set under study, e.g. a list of differentially regulated genes, as the Input Yes gene set. You can drag & drop it from your project within the Tree Area and drop in the pink box of the field Input gene set. Input gene set used for example
Step 2: Specify the biological species of the input set in the field Species by selecting the required species from the drop-down menu.
Step 3: Input a No gene set. This is the set of background genes or control set. The default No set used for this workflow is data/Examples/Sample data/Data/Housekeeping genes (Human). If your Yes set is from mouse or rat, you may wish to adjust the No set accordingly.
Step 4: Define a TRANSFAC® profile. The default profile is vertebrate_non_redundant_minSUM. Any other TRANSFAC® profile or user-specific profile can be chosen. With a mouse click on the field Profile, a pop-up window will open, where a profile can be selected.
Step 5: Define the promoter regions to be analyzed. The default promoter region is from -1000 to 100 relative to the TSS as annotated in the Ensembl database. You can adjust Start of promoter and End of promoter by typing in the corresponding fields.
Step 6: Define where the folder with the results should be located in your project tree. You can do so by clicking on the pink box (select element) in the field Results folder, and a new window will open, where you can select the location of the results folder and define its name.
Step 7: Press the [Run workflow] button. Wait until the workflow is completed, and take a look at the results.
Visualization and interpretation of results
The Output folder for Upstream Analysis with feedback loop contains several files and can be accessed from the link below:
Master regulators
The primary result table Master regulators upstream 10 () is a list of master regulatory molecules that were identified at a distance of up to 10 steps upstream of the input TFs. Each master regulatory molecule is
characterized by a Score, Z-score, FDR, and Ranks Sum.
The selection of the best master regulatory molecules based on Score, Z-score and Ranks sum is explained therein under “Interpretation of the results”.
The three Top 3 regulators diagrams ()visualize the networks for each of the three top master regulators. By default, the top regulators are identified upon sorting the Master regulators upstream
10 table () by the column Ranks sum with the lowest rank on top.
The three Top 3 regulators diagrams with Expression () visualize the networks for each of the three top master regulators, which have expression values from the input table. These master regulators with expression values are the results of a feedback loop; they are regulated by themselves. By default, the top regulators with expression values are identified upon sorting the Master regulators with input expression_filtered () by the column Ranks sum with the lowest rank on top.
Note*.* This workflow is available together with valid TRANSFAC® and TRANSPATH® licenses. Please feel free to ask for details (info@genexplain.com).