Metabolism
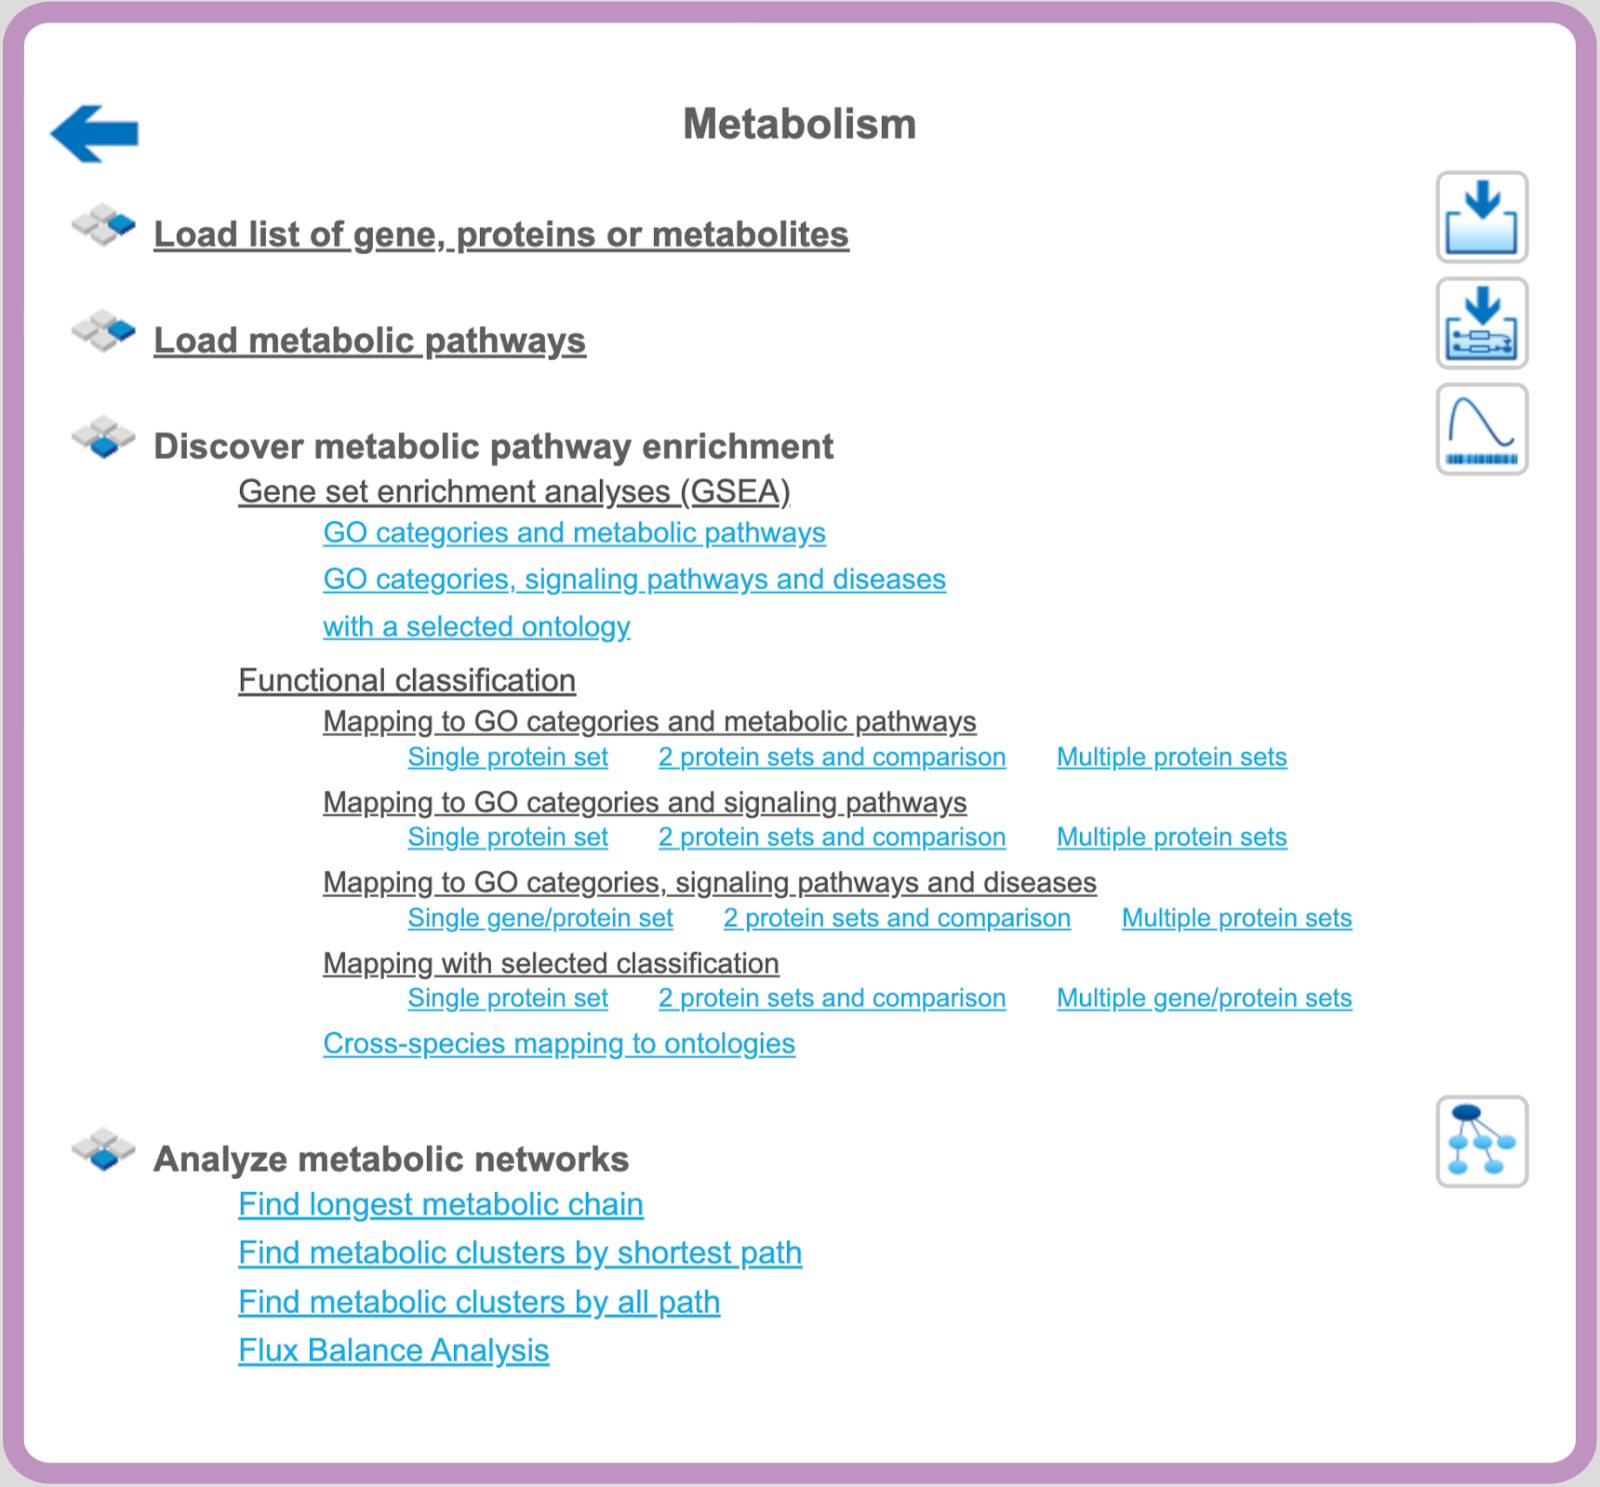
Analyze metabolic networks
Find longest metabolic chain
The goal of this analysis is to find longest chains which contain as many elements from the input collection as possible. Here chain means a path which starts and ends with the elements from the input collection. In this path the length between two elements from the input collection is limited by the maximum search radius.
This method can be found under the analyses tab using the path analyses/Methods/Molecular networks/Find longest connected chains.
The input form of the method looks as shown below:
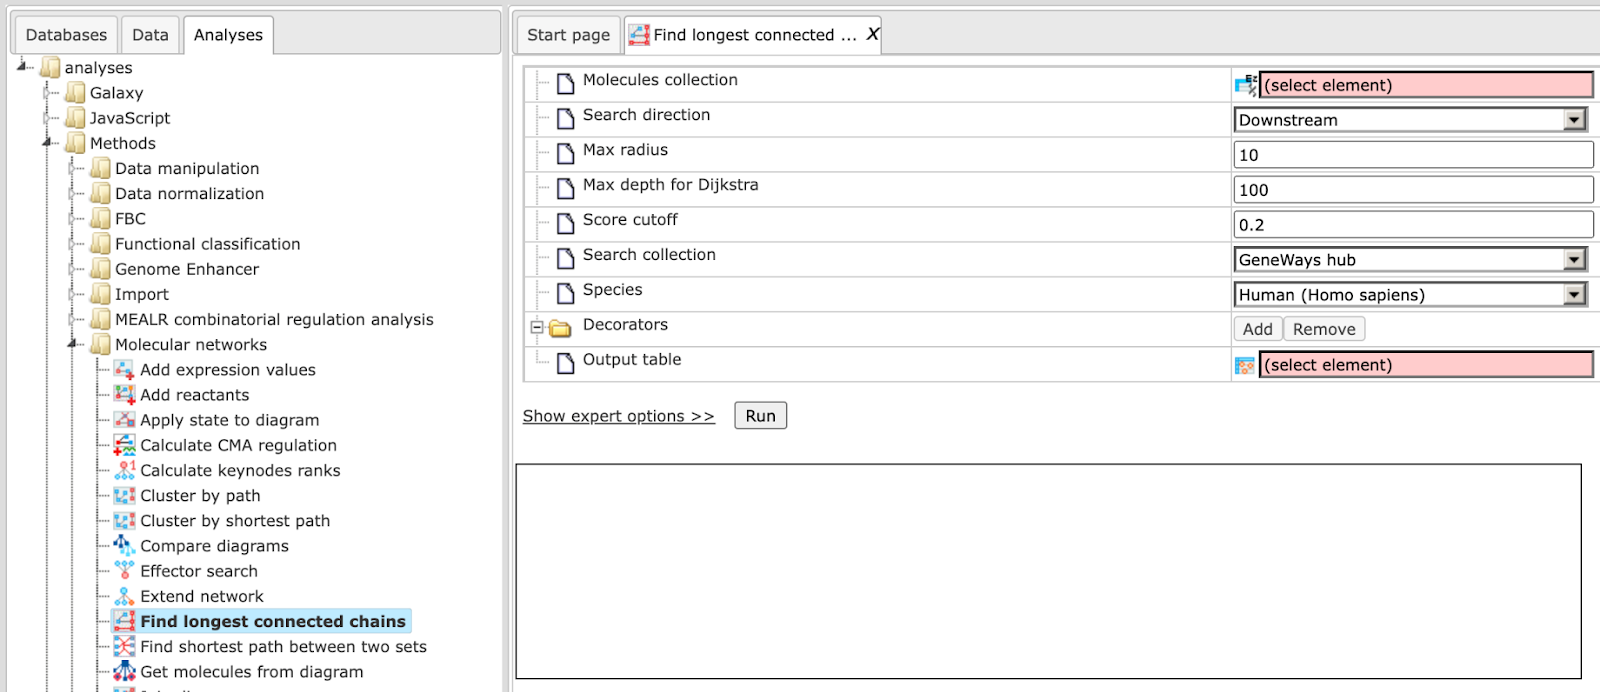
Step 1: Specify the Molecules collection, which can be any molecule, protein or gene list.
To specify the input table, you can drag & drop it from your project within the tree area.
Step 2: Specify the Search direction, either upstream, downstream reactions or both directions.
Step 3: Selection of Maximal search radius, the default is 10.
Step 4: Selection of Maximal depth which will be used by the Dijkstra search algorithm, the default is 100.
Step 5: Specify the Score cutoff – Molecules with a Score lower than specified will be excluded from the result.
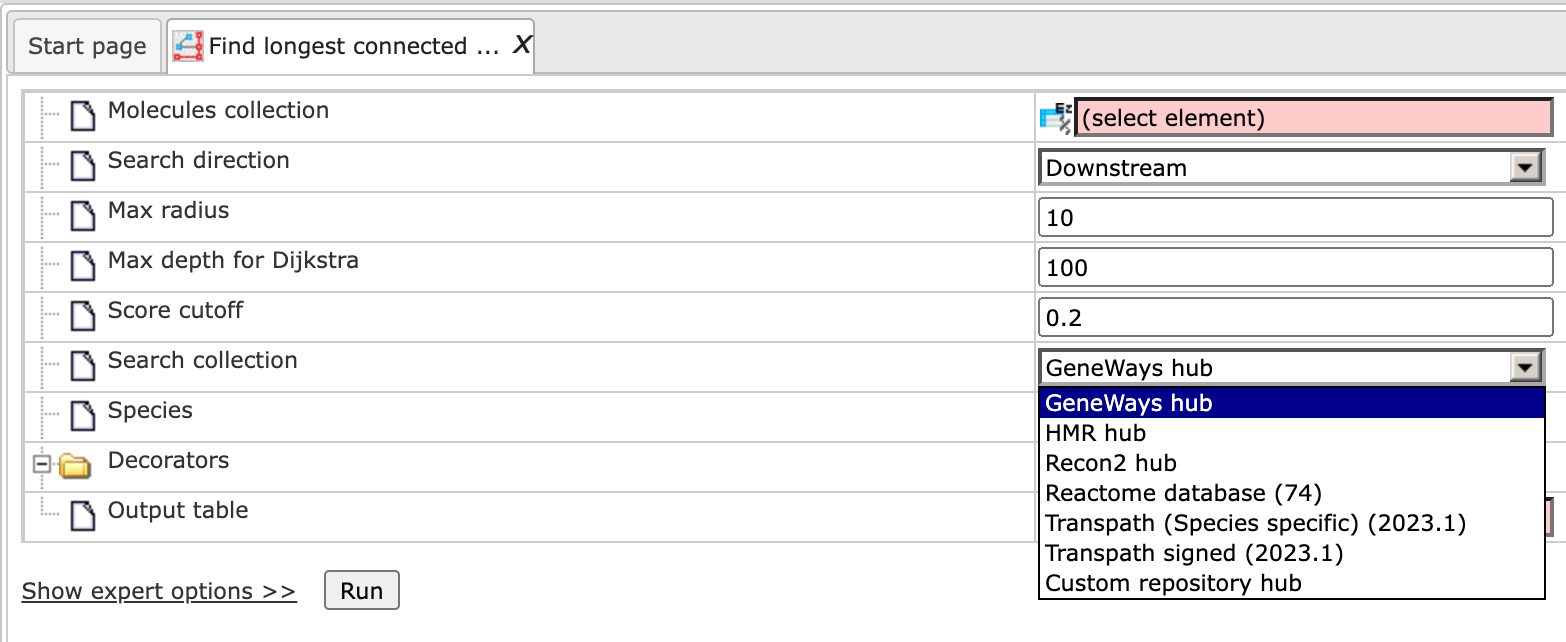
Step 6: Specify the Search collection, which can be one of the drop-down menu shown below.
Step 7: Specify the biological species of the input set in the field Species by selecting the desired species from the drop-down menu.
Step 8: Define where the folder with the results should be located in your project tree. You can do so by clicking on the pink box (select element) in the field Output name, and a new window will open, where you can select the location of the results folder and define its name.
Example output will look like this:
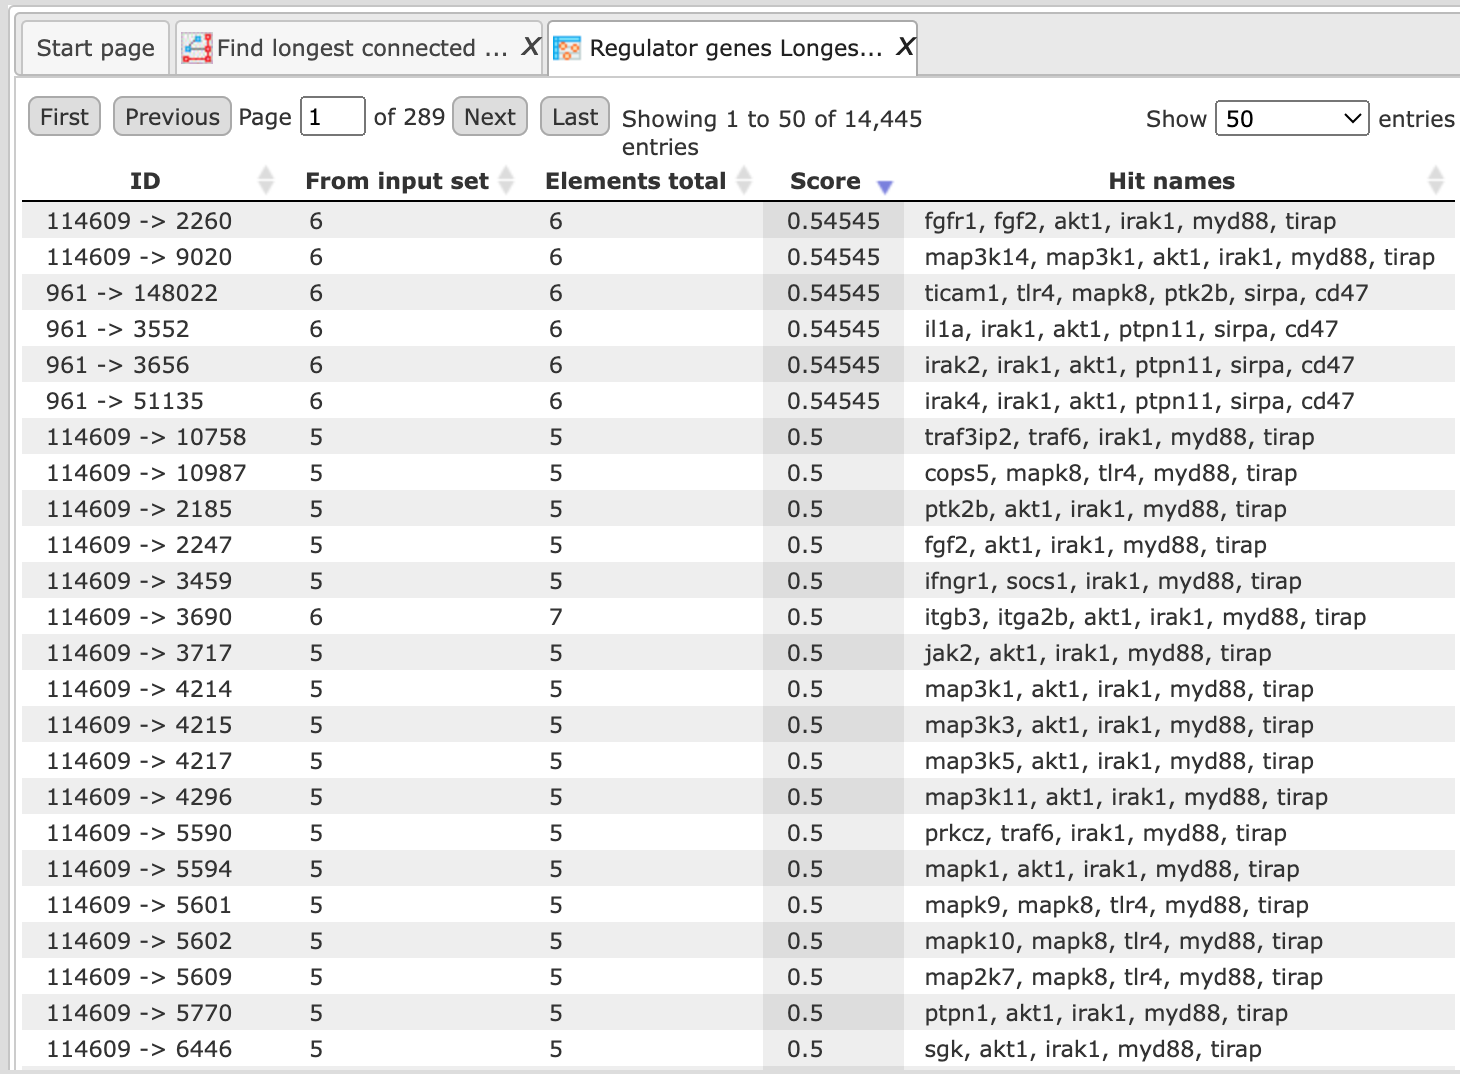
All chains within the radius 10 are included in the results. You can click on each row and visualize the results as shown below:
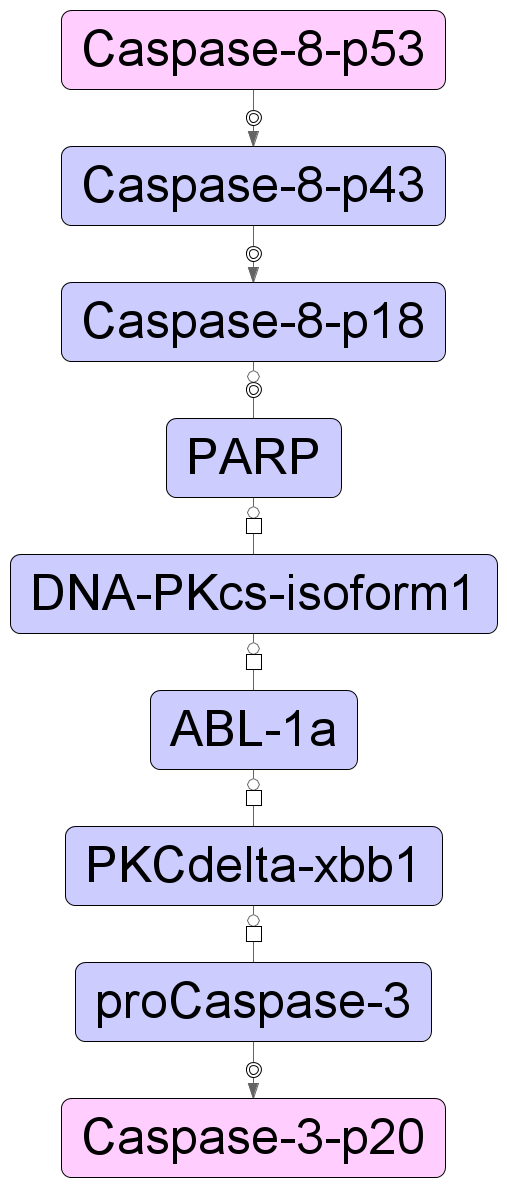
Similarly, other long chains can be visualized from the result table.
Find metabolic clusters by shortest path
Please refer to the description of the method cluster by shortest path and apply the steps explained there correspondingly.
Find metabolic clusters by all path
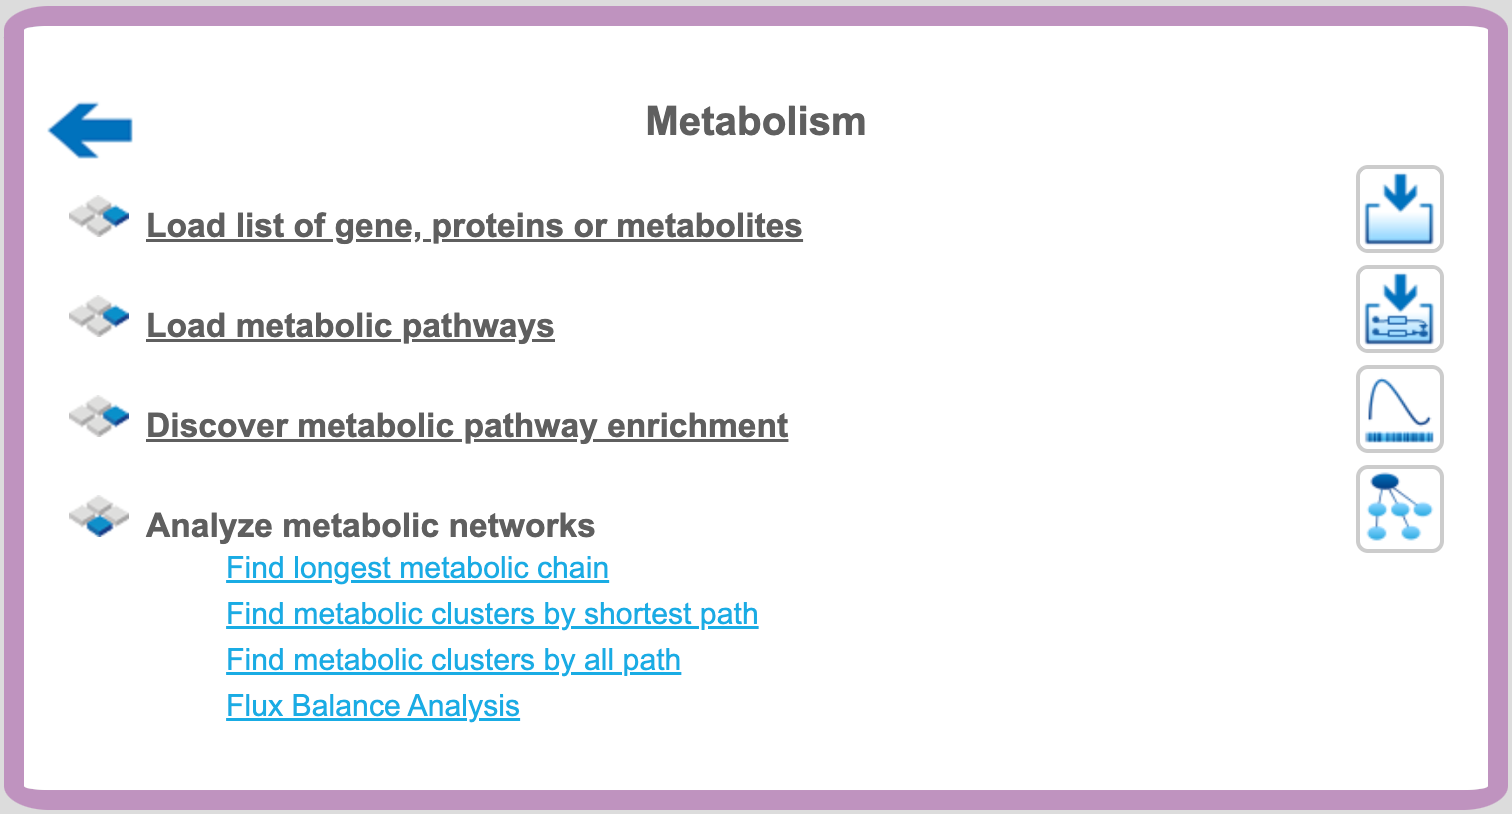
This analysis allows you to generate a cluster of genes/molecules upstream or downstream or both by taking reactions and all intermediate molecules from a specified search collection. To launch the analysis, open the method form from the Start page:
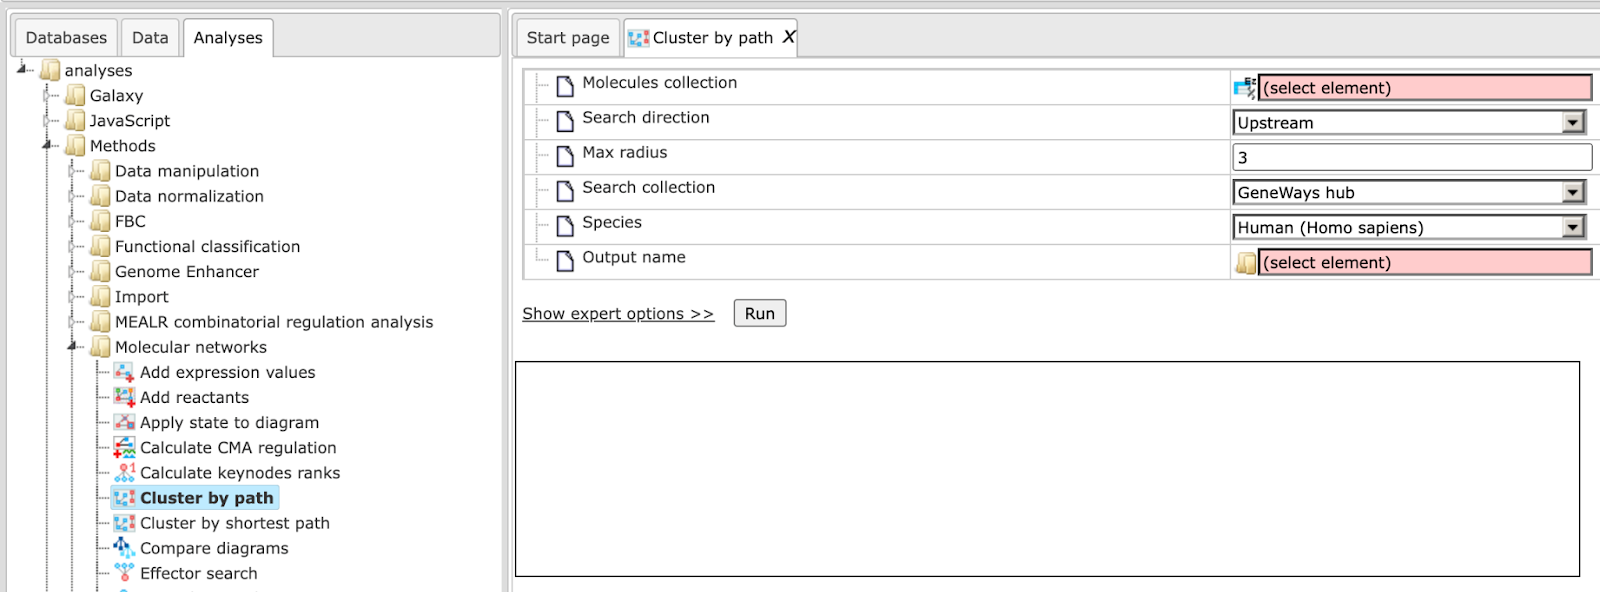
Step 1: Specify the Molecules collection, which can be any molecule, protein or gene list.
To specify the input table, you can drag & drop it from your project within the tree area.
Step 2: Select the maximum Input size (expert modus).
Step 3: Specify the Search direction, either upstream, downstream reactions or both directions.
Step 4: Selection of Maximal search radius, the default is 3.
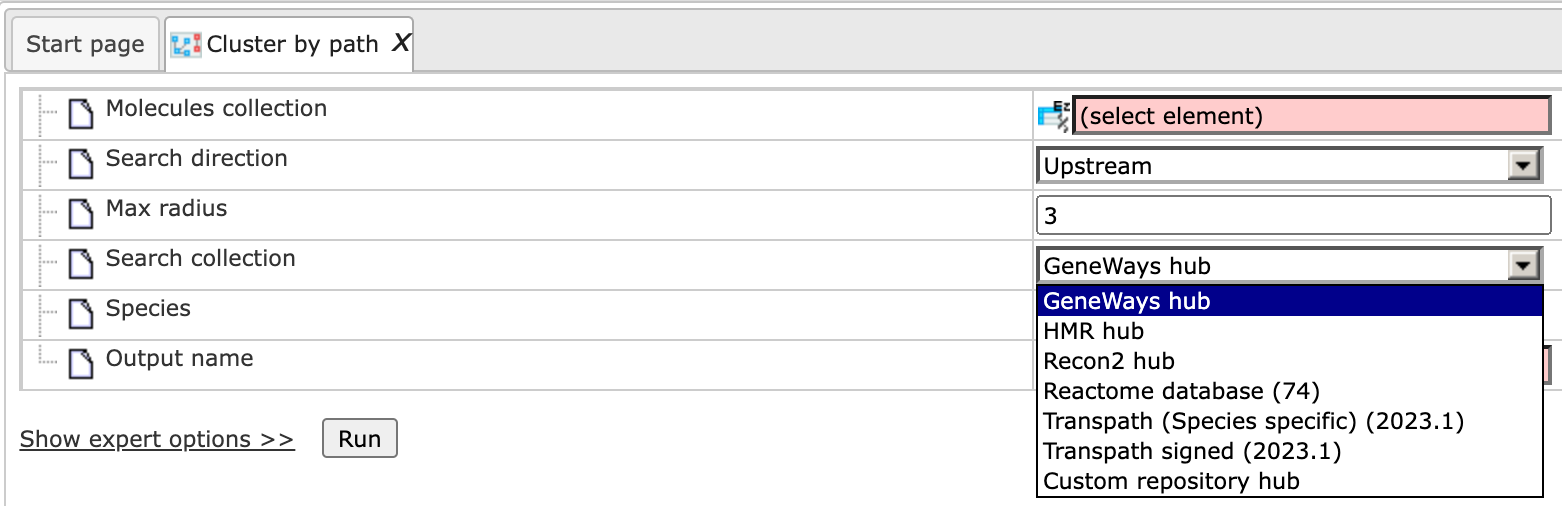
Step 5: Specify the Search collection, which can be one of the drop-down menu shown below.
Step 6: Specify the biological species of the input set in the field Species by selecting the desired species from the drop-down menu.
Step 7: Define where the folder with the results should be located in your project tree. You can do so by clicking on the pink box (select element) in the field Output name, and a new window will open, where you can select the location of the results folder and define its name.
Flux Balance Analysis
To launch this workflow, open the workflow input form from the Start page:
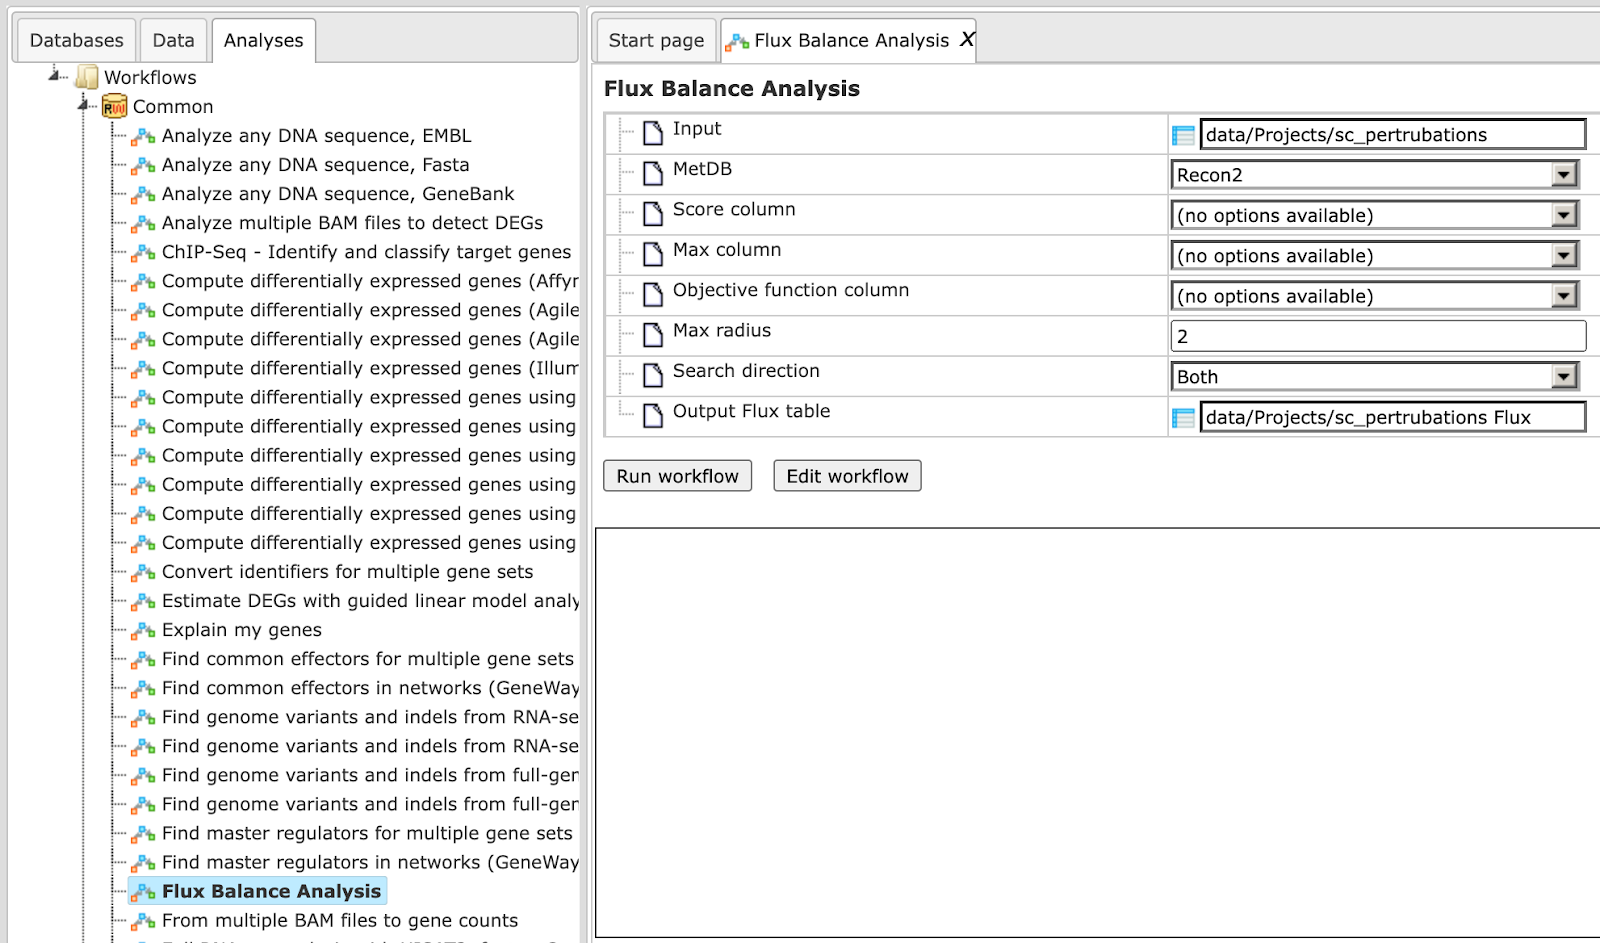
Step 1: Specify a gene set under study, e.g. a list of differentially regulated genes, as the Input Yes gene set. You can drag & drop it from your project within the Tree Area and drop in the pink box of the field Input gene set.
In this example we analyzed data from this study:
https://www.ebi.ac.uk/biostudies/arrayexpress/studies/E-MTAB-3017
Step 2: Specify the metabolism database (MetDB) by selecting Recon2 or HMR from the drop-down menu. As default the Recon2 database is selected.
Step 3: Define the Score column, Max column and Objective function column by selecting one numerical column from your input table from the drop down menu.
Step 4: Define the Max radius, which is the maximal number of steps within the selected metabolism database. The default value is 2.
Step 5: Specify the Search direction by selecting from the drop-down menu; default is both.
Step 6: Define where the output table should be located in your project tree. You can do so by clicking on the pink box (select element) in the field Output flux table, and a new window will open, where you can select the location of the results table and define its name.
Step 7: Press the [Run workflow] button. Wait until the workflow is completed, and take a look at the results.
Visualization and interpretation of results
The results consist of several files and one folder:
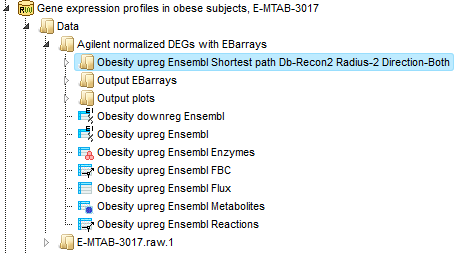
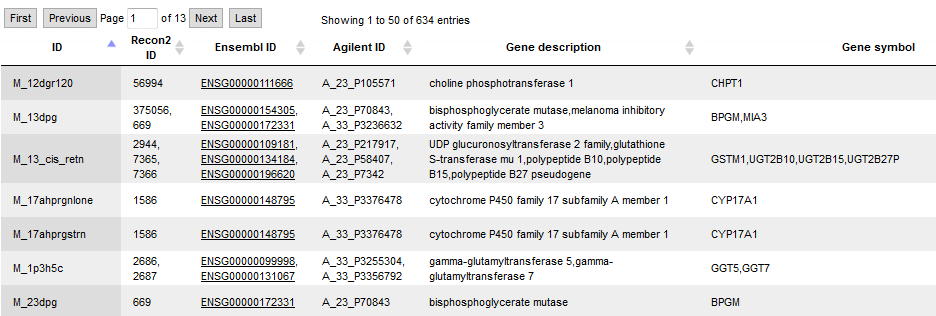
The first step of the workflow is to convert the input genes into enzymes (output example: Obesity upreg Ensembl Enzymes). Next step is to match the enzymes with metabolites (output example: Obesity upreg Ensembl Metabolites). The 634 metabolites are listed in table format with Recon2 IDs.
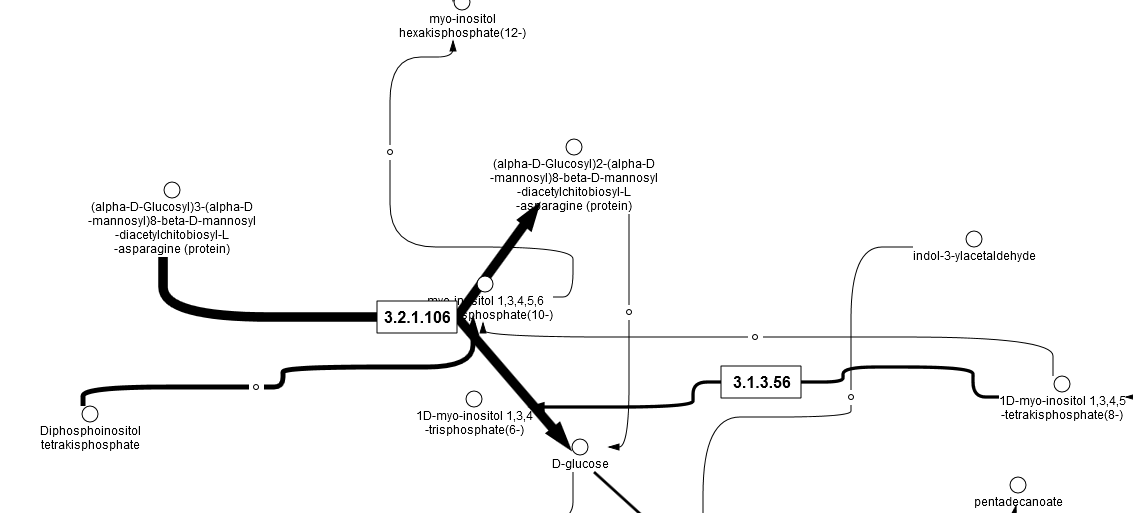
Parallel to the described conversion and match steps, the enzyme list is converted into an enzyme reaction table (output example: Obesity upreg Ensembl Reactions), and 663 reactions are listed in table format with Recon2 IDs. Then a Flux Balance Table (Obesity upreg Ensembl FBC) is calculated, where the input parameters Score column, Max column and Objective function column are used. After that, a table with flux data is constructed. From this Obesity upreg Ensembl Flux table, together with the first cluster, a new diagram (Cluster 1 flux) is created, which shows the input proteins from cluster 1 with added and calculated flux information. A screen from the output is shown below:
The folder Obesity upreg Ensembl Shortest path Db-Recon2 Radius-2 Direction-Both contains all results from the cluster analysis within the workflow.